
Zendesk Sales Performance Dashboard
Analyze Zendesk Sales, pipeline stages, and deal velocity in one dashboard to improve close rates and forecast accuracy.
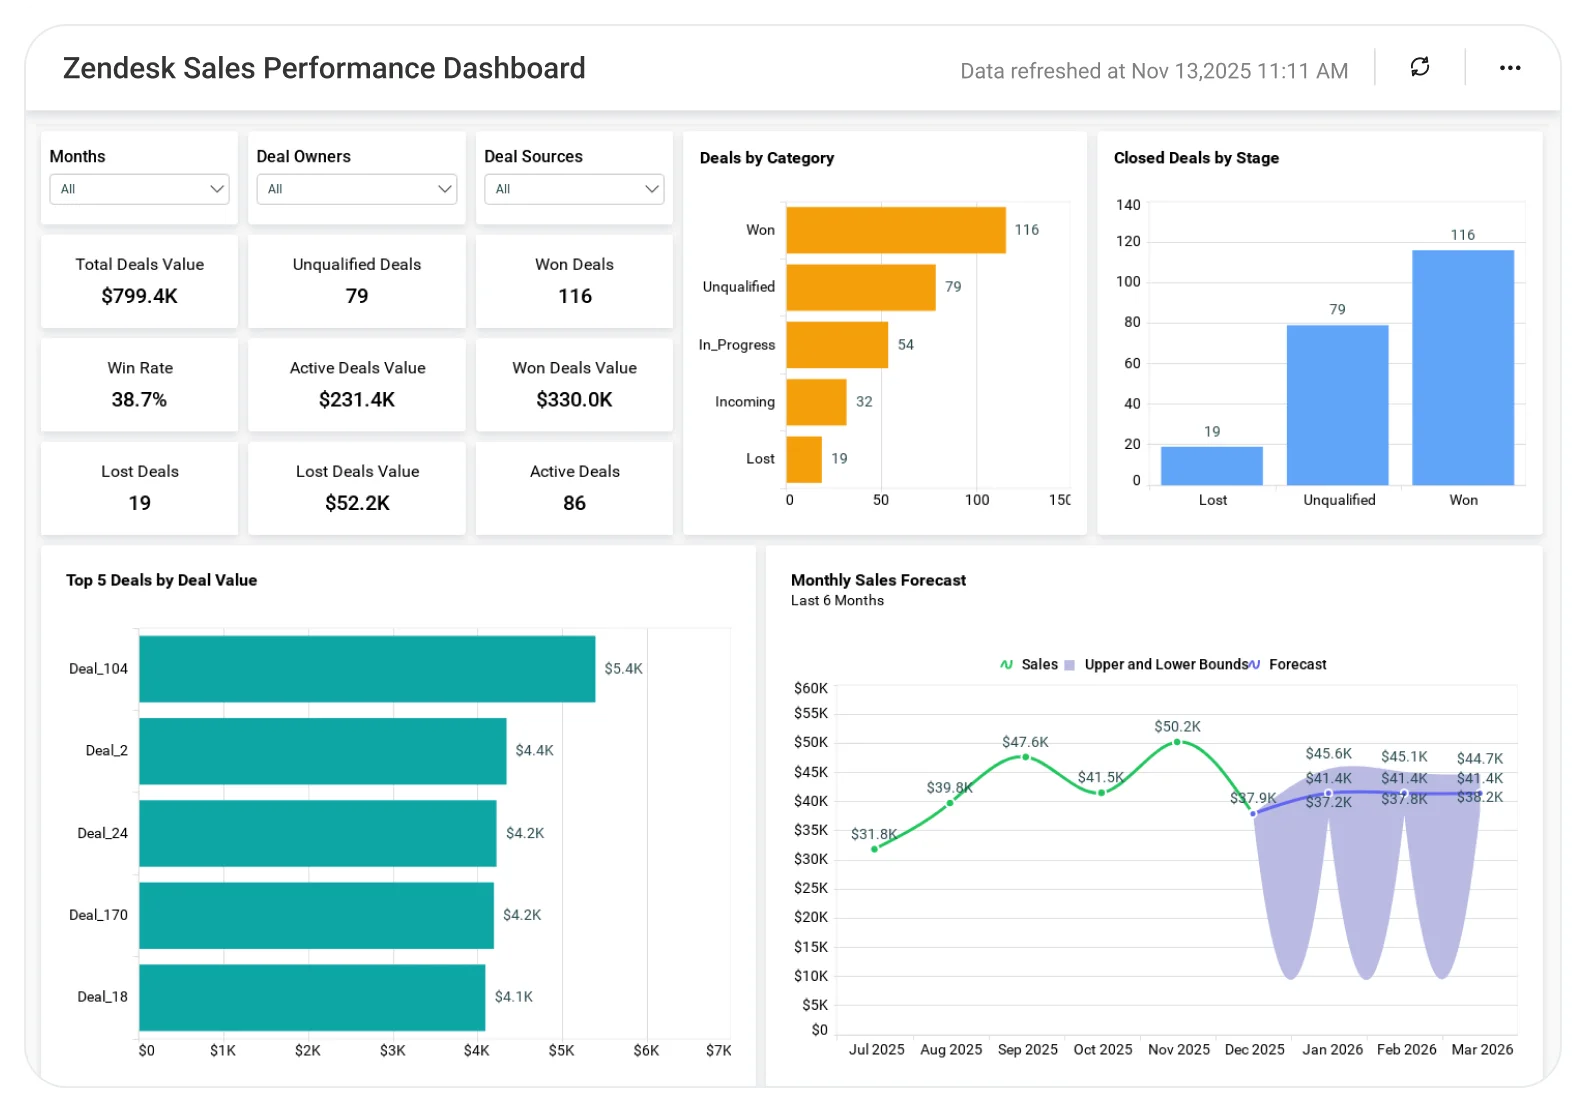
The Zendesk Sales Performance Dashboard gives sales leaders a clear view of how deals move through the pipeline, showing where opportunities slow down, which stages leak value, and which deals need immediate attention.
TL;DR
-
Monitor stage-wise deal distribution and conversion behavior to spot pipeline leaks.
-
Identify stalled and slow-moving deals early to prevent revenue slippage.
-
Compare deal performance by sales rep and pipeline stage to guide coaching and prioritization.
-
Track overall deal volume and pipeline value trends to understand revenue momentum.
-
Improve win rates and forecast accuracy with data-driven deal execution insights.
What Is a Zendesk Sales Performance Dashboard?
A Zendesk Sales Performance Dashboard is an analytics solution that helps sales teams evaluate how opportunities progress from early stages to closure and identify where deals lose momentum.
With Bold BI, deal data from Zendesk Sell is transformed into clear, actionable insights, enabling sales teams to prioritize the right opportunities, intervene earlier, and manage pipelines with confidence rather than assumptions.
Why Zendesk Sales Performance Dashboard Matters
Pipeline size alone doesn’t guarantee revenue.
When teams rely only on CRM lists and basic reports:
-
Stalled deals stay hidden until it’s too late.
-
Sales effort spreads thin across low-quality opportunities.
-
Stage bottlenecks remain unclear.
-
Forecasts become optimistic rather than realistic.
What You’ll Track
Using Bold BI dashboards, you will track important KPIs such as:
-
Deal volume & value trends: Number of deals and total pipeline value over time to understand revenue momentum.
-
Stage-wise deal distribution: Deals grouped by pipeline stage to identify concentration and drop-off points.
-
Deal velocity metrics: Time deals spend in each stage to highlight stalled or slow-moving opportunities.
-
Sales owner performance: Deal progression, velocity, and close effectiveness by sales rep or team.
All dashboards are fully customizable, allowing you to add KPIs or metrics as needed.
How It Works
-
Connect your Zendesk Sell data to Bold BI.
-
Apply the Zendesk Sales Performance Dashboard sample.
-
Combine deal value, stage, ownership, and timeline data in one unified view.
-
Analyze insights by pipeline, stage, owner, or time period.
-
Share dashboards with sales managers and leadership teams.
Why Bold BI Is the Right Fit for Zendesk Sales Performance Analytics
-
Surfaces deal slippage before it impacts revenue: Identifies deals that sit too long in specific stages, enabling managers to act before close dates slip.
-
Helps sales teams focus on deals that are likely to close: Highlights high-value and high-probability opportunities instead of spreading effort across every open deal.
-
Makes stage-level pipeline issues impossible to ignore: Clearly shows where deals stall, qualification, negotiation, or closing, so bottlenecks are addressed rather than guessed.
-
Improves forecast confidence, not just forecast numbers: Combines deal value, velocity, and stage behavior to support realistic, defensible revenue projections.
-
Enables data-backed sales coaching: Reveals rep-level deal handling patterns, helping managers coach based on actual deal behavior rather than gut feel.
Compare Options (at a glance)
| Feature | Bold BI | Zendesk Sell Views | Spreadsheets |
| Deal performance analytics | Yes | Limited | Manual |
| Stage-wise conversion insights | Yes | Partial | Manual |
| Deal velocity tracking | Yes | Limited | Manual |
| Sales rep performance views | Yes | Limited | Manual |
| Custom KPIs & drilldowns | Fully customizable | Fixed | Manual |


