
Copper Sales Opportunities Dashboard
Turn Copper CRM data into clear, actionable, revenue driving strategies.
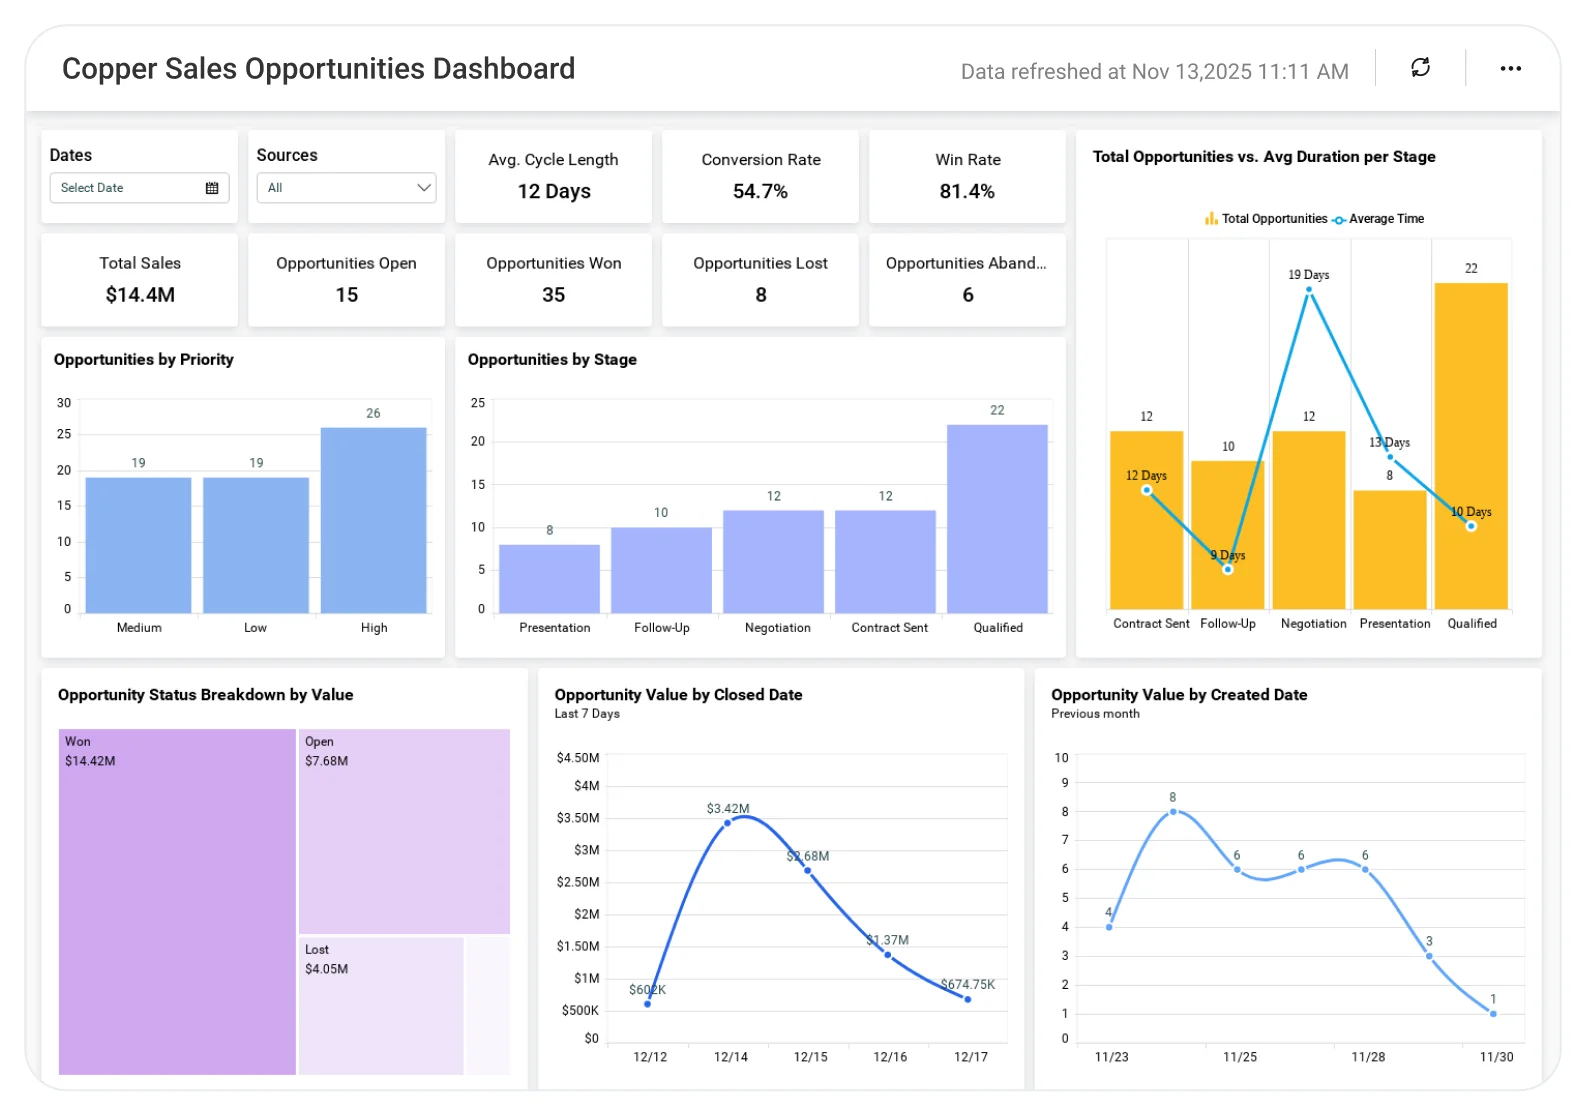
The Copper Integration Sales Opportunities Dashboard in Bold BI gives sales managers and business owners an easy way to track performance and make informed decisions. Connect to Copper CRM and view opportunities in a clean dashboard so you can spot risks, prioritize next steps, and keep pipeline moving.
TL;DR
-
Real-time Copper CRM analytics: Monitor opportunities, conversions, and sales pipelines.
-
Benchmarking: Compare results to past performance (and industry benchmarks if you have them).
-
Goal tracking: Track targets vs. actuals and monitor win rate over time.
-
Customizable visuals: Dashboards can be aligned with the KPIs of your team.
-
Data-driven insights: Faster and smarter sales decisions can be made.
What Is a Copper Sales Opportunities Dashboard?
A Copper Sales Opportunities Dashboard gives sales teams a clear, real-time view of all opportunities in Copper CRM including deal status, value, conversion rates, and revenue trends.
With Bold BI, these insights are delivered through interactive visuals and filters, helping teams quickly understand performance, track progress, and adjust sales strategies to improve win rates and shorten sales cycles.
Why Copper Sales Opportunities Dashboard Matters
Sales teams rely on timely and accurate opportunity data to close deals and forecast revenue. When opportunity information is scattered across CRM screens or limited to static reports, it becomes difficult to spot stalled deals, understand conversion performance, or respond quickly to changes in the pipeline.
A Copper Integration Sales Opportunities Dashboard provides real-time visibility into deal status, values, and conversion trends, helping sales leaders identify risks early, improve win rates, and make confident, data-driven decisions that drive consistent revenue growth.
What You’ll Track
Using Bold BI dashboards for Copper Sales Opportunities, you will track critical KPIs such as:
-
Lead conversion rate: Monitor how effectively your leads are converting into opportunities and closed deals over time.
-
Pipeline Performance: Visualize the health of your sales pipeline, including stages, deal sizes, and expected close dates.
-
Opportunity Insights: Understand a clear breakdown of opportunities by source, region, product category, and sales rep performance.
-
Revenue Forecast Accuracy: Get simple views that show how your projected revenue compares to actuals, helping you identify gaps early.
-
Sales trends: Analyze long-term patterns in opportunity creation, deal closure rates, and revenue growth to optimize strategies.
All dashboards are fully customizable, allowing you to add KPIs or metrics as needed.
How It Works
-
Connect: Copper CRM can either be integrated via API or transferred via database.
-
Apply sample: Choose the Sales Opportunities Dashboard of Copper Integration.
-
Blend: Combine Copper data with either marketing or financial metrics.
-
Share: Distribute secure, role-based dashboards to every group or manager.
-
Act: Keep an eye on KPIs, find holes, and enhance sales performance overall.
Why Bold BI Is the Right Fit for Copper Sales Opportunities Analytics
-
Complete analytics: Combine Copper CRM data with other sources.
-
Instant tracking: Get instantaneous information on every transaction and KPI.
-
Deep drilldowns & customization: Customize visuals, KPIs, and filters to match your sales process and performance standards.
-
Secure & governed access: Use Row Level Security, Single Sign-On, RBAC for secure sharing.
Compare Options (at a glance)
| Feature | Bold BI | Copper Built-in Reports | Spreadsheets |
|---|---|---|---|
| Opportunity pipeline performance | Yes | Limited | Manual |
| Win rate, average deal size, and sales cycle length | Yes | Partial | Manual |
| Stage conversion & pipeline velocity (bottlenecks, drop-offs) | Yes | Limited | Manual |
| Forecast vs. target tracking (expected vs. actual revenue) | Yes | Partial | Manual |
| Opportunity aging & stalled deal alerts | Yes | Limited | Manual |
| Drilldowns by pipeline, owner, source, and timeframe | Yes | Limited | Manual |
| Custom KPIs, targets, and dashboards | Fully customizable | Fixed | Manual |
Frequently Asked Questions
More Articles About Copper Sales Opportunities
-
Copper Sales Opportunities Dashboard: 5 Key Metrics to Track
 This blog explains essential KPIs for monitoring sales opportunities in Copper and improving pipeline visibility.
-
Maximizing Sales Impact: A Dive into Funnel BI Optimization
This blog shows how BI optimizes sales funnels, helping teams identify bottlenecks and boost conversion rates.
-
Spotting Sales Opportunities with Line Chart Visualization
This blog discusses how line charts reveal trends and patterns, enabling smarter decisions for sales growth.


