
Sales Performance Dashboard
Understand sales performance to improve revenue growth and team effectiveness.
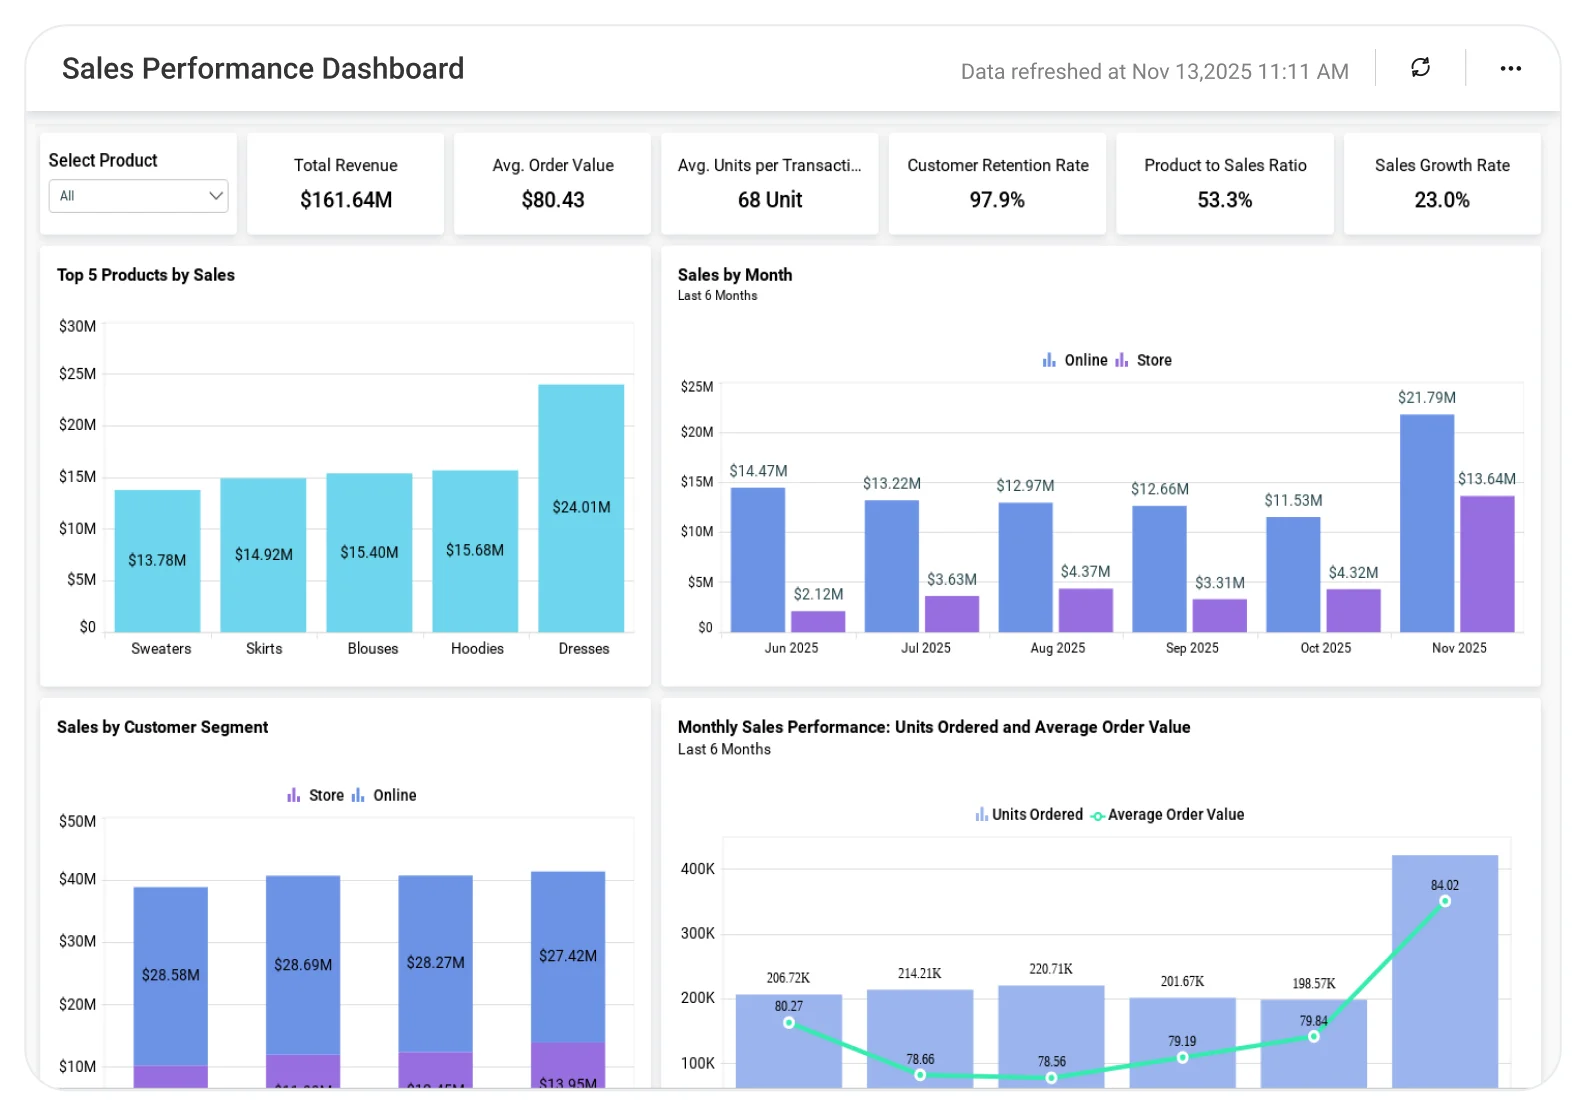
The Sales Performance Dashboard helps teams analyze revenue trends, target achievement, pipeline status, and team productivity, enabling better coaching, accurate forecasting, and stronger sales outcomes.
TL;DR
-
Real-time visibility: Total sales, products sold, and performance by product.
-
Growth comparisons: YOY and MOM revenue trends.
-
Channel insights: Online vs. in-store order distribution.
-
Product analytics: Top performers and revenue contribution.
-
Executive view: Revenue trends, stock turnover, and demand signals.
What Is a Sales Performance Dashboard?
A sales performance dashboard provides a live view of revenue, product movement, and sales velocity across your business.
With Bold BI, this includes:
-
Up-to-date sales, revenue, and inventory metrics.
-
Visual trends for long-term growth.
-
Filters for SKUs, categories, and regions.
It becomes a single source of truth for tracking performance and guiding strategy.
Why Sales Performance Dashboard Matters
Sales performance data is often spread across sales systems, inventory tools, and spreadsheets, making it difficult to understand what’s driving revenue and demand. Without a unified view, teams struggle to track sales velocity, spot declining products, or respond quickly to market changes.
A Sales Performance Dashboard brings revenue, product movement, and inventory trends together in one place. This helps sales teams monitor performance in real time, identify growth opportunities early, and align strategy with actual demand.
What You’ll Track
-
Revenue overview: Total sales, daily and monthly movement, YOY comparisons.
-
Product insights: Top-selling items and revenue contribution.
-
Channel performance: Online vs. in-store sales.
-
Sales trends: Seasonal patterns and progress toward targets.
-
Inventory health: Turnover ratios and early warnings for slow movers.
Each dashboard is fully customizable, allowing you to add KPIs, adjust thresholds, and combine sales, inventory, and customer data in one view.
How It Works
Bold BI connects your sales and inventory data sources and transforms them into interactive dashboards.
-
Auto-refresh metrics: Dashboards update automatically with the latest sales and revenue data.
-
Explore with filters: Analyze performance by SKU, product category, region, or time period.
-
Share securely: Control access with role-based permissions and share insights with teams and leadership.
Why Bold BI Is the Right Fit for Sales Performance Analytics
-
Unified sales visibility: Combine sales, inventory, and product data into a single source of truth.
-
Actionable revenue insights: Track revenue trends, demand patterns, and product movement with visual clarity.
-
Self-service analytics: Enable sales teams to drill down by product, region, channel, or time without relying on IT.
-
Secure & governed sharing: Protect data using Row Level Security(RLS), Single Sign On(SSO), Role Based Access Control(RBAC), and audit logs.
Compare Options (at a glance)
| Feature Feature | Bold BI | CRM Built-in Reports | Spreadsheets |
|---|---|---|---|
| Revenue & sales trend tracking (MoM/YoY) | Yes | Limited | Manual |
| Quota attainment & performance scorecards | Yes | Partial | Manual |
| Pipeline health & forecast accuracy | Yes | Limited | Manual |
| Drilldowns by rep, territory, product, and customer | Yes | Limited | Manual |
| Custom KPIs & dashboards | Fully customizable | Fixed | Manual |
Frequently Asked Questions
More Articles About Sales Performance Dashboard
-
15 Essential KPI Dashboard Examples for Your Business
 Includes KPI dashboards for sales and other industries. Great for understanding how KPIs drive actionable insights.
-
Expand Sales with Embedded Product & Supplier Insights
Explains how embedded analytics improve sales performance. Covers benefits like strategic decision-making and inventory management.


