Department : Sales

Sales Activity Tracker Dashboard for Sales Leaders 

Understand sales activities to improve follow-ups and overall sales productivity.

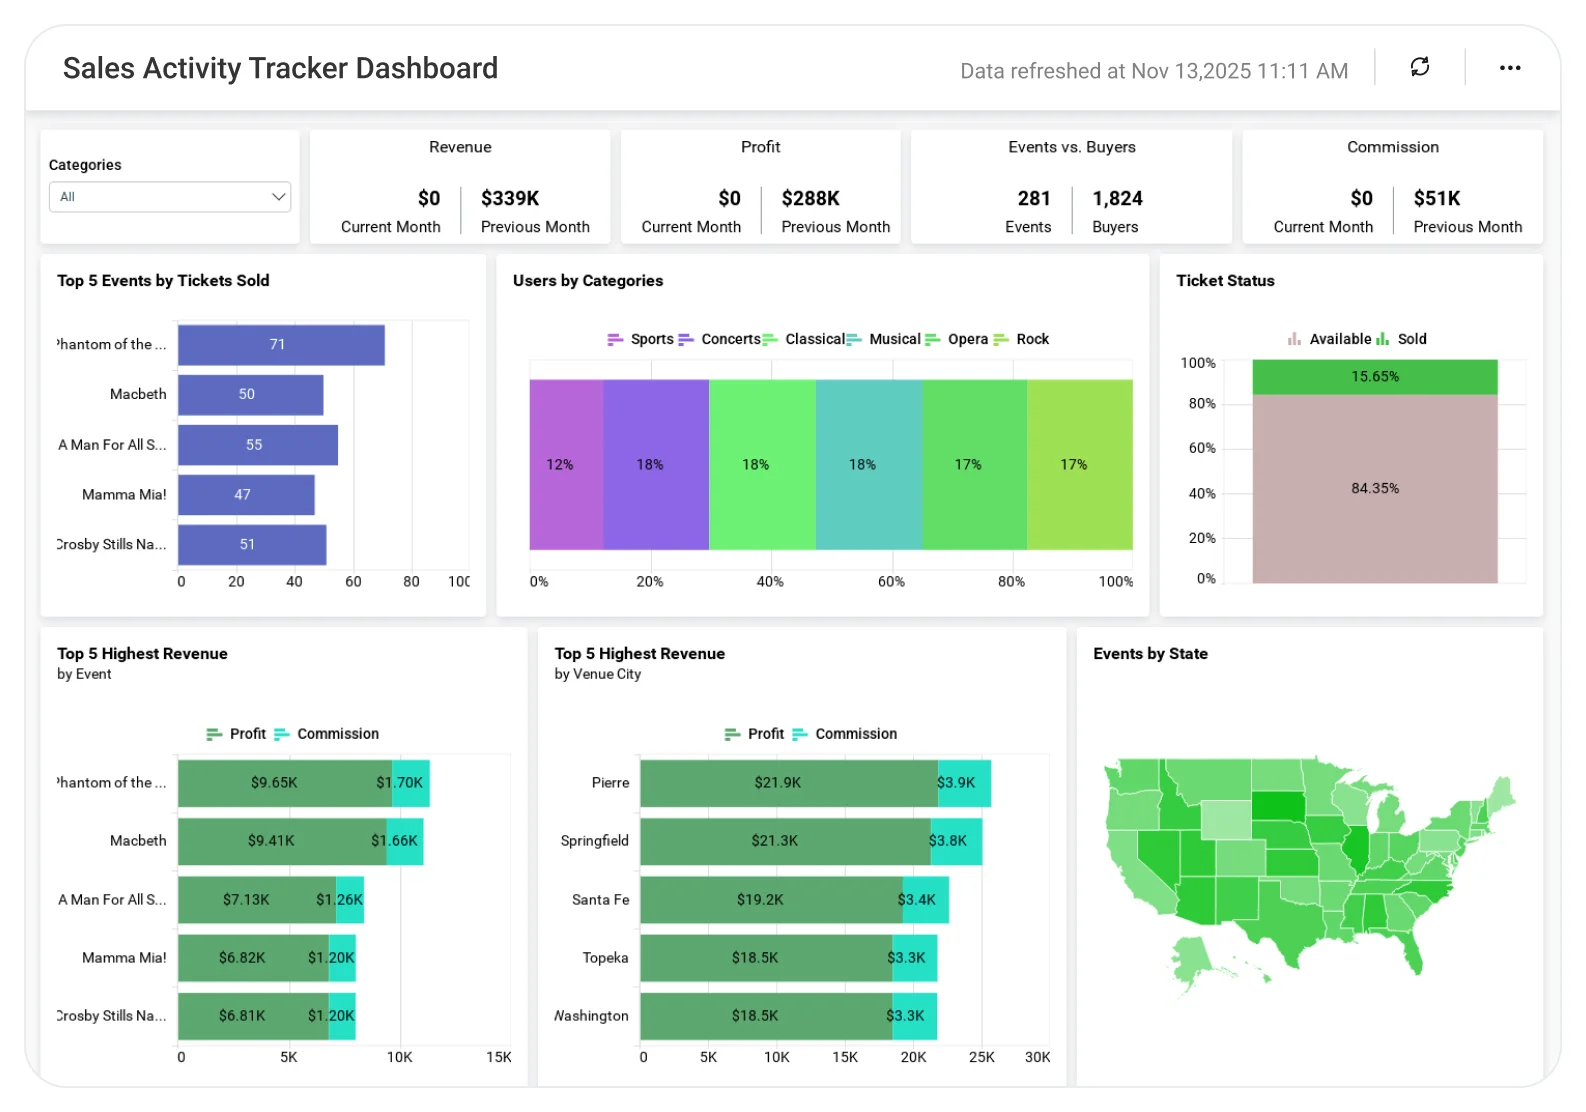
The Sales Activity Tracker Dashboard helps teams analyze calls, meetings, tasks, and follow-up activities, enabling better time management, improved accountability, and more effective sales execution.
TL;DR

Sales teams use this dashboard to reduce manual reporting and improve forecast visibility. 

  • Activity visibility: Calls, meetings, and follow-ups by rep or territory.  
  • Pipeline health: New opportunities, conversion rates, and forecast accuracy.  
  • Revenue trends: Booked vs. target revenue and deal velocity in real time.  
  • Team performance: Compare activity effectiveness across teams or individuals.  
  • Executive summary: A complete view of sales from prospecting to close.

What Is a Sales Activity Tracker Dashboard?   

A sales activity tracker dashboard helps leaders connect rep activity to pipeline movement and revenue. 

Bold BI combines interactive visualizations, alerts, and drill-down analytics to help leaders coach more effectively, forecast accurately, and scale growth.  

Why Sales Activity Tracker Dashboard Matters

When activity data is spread across tools, it’s hard to see what drives results.Bold BI brings everything together so you can answer questions like:

  • Are reps focusing on the right activities to hit quota?  
  • Which regions or channels convert best?  
  • Where are deals getting stuck?  
  • How do activities translate into revenue?  

What You’ll Track  

  • Lead Activity: Calls, meetings, and emails per rep.   
  • Pipeline Conversion: Opportunity stages, win rates, and average deal value.   
  • Revenue vs. Target: Booked revenue vs. quota across teams.   
  • Forecast Accuracy: Predicted vs. actual closures by month or quarter.   
  • Top Performers: Leaderboards by deal volume, activity count, and close ratio.

How It Works

  • Connect your data: Salesforce, Hubspot, or Zoho CRM, Excel, SQL, or ERP systems.  
  • Choose a sample: Start with pre-built KPIs for activity, pipeline, and forecasting.
  • Blend your data: Combine CRM, finance, and marketing insights for full visibility.  
  • Share dashboards: Role-based views for reps, managers, and execs.    
  • Set up notifications: Get notifications when pipeline activity or coverage decreases.  

Why Bold BI is the Right Fit for Sales Activty Tracker Analytics

  • Visibility: A single platform for revenue analytics, marketing, and sales.
  • Drill-down: Move from regional summaries to individual rep performance.
  • Security: Enterprise-grade security with SSO, RBAC, and RLS
  • Embedding: Dashboards that can be integrated into your CRM workspace or portal.   
  • Adaptable deployment: self-hosted or cloud-based for compliance.

Compare Options (at a glance)

Feature Bold BI CRM Activity Reports Spreadsheets
Activity volume tracking (calls, emails, meetings) by rep/team Yes Limited Manual
Activity-to-outcome analysis (activities vs. pipeline/revenue) Yes Partial Manual
Rep productivity trends (daily/weekly/monthly) Yes Limited Manual
Follow-up and SLA monitoring (overdue tasks, response time) Yes Partial Manual
Drilldowns by rep, territory, account, and activity type Yes Limited Manual
Custom KPIs & dashboards Fully customizable Fixed Manual

Frequently Asked Questions

CRM reports focus on stored records, while a sales activity tracker connects activities, pipeline movement, and revenue across multiple data sources to provide deeper performance insights.
It improves performance by showing which activities drive results, highlighting gaps in rep engagement, and enabling data-driven coaching and pipeline optimization.
Yes. Many platforms allow dashboards to be embedded directly into CRMs or internal tools, so users don’t need to switch systems.
Yes. You can host the application in your environment for Windows, Linux, Docker, Kubernetes, and Azure App Service environments.
Yes. Drill down by region, product line, or rep to measure impact and coach effectively.
Yes Bold BI supports SSO, RBAC,and RLS, to protect sensitive sales data.

Compare Options (at a glance)

Feature Bold BI CRM Activity Reports Spreadsheets
Activity volume tracking (calls, emails, meetings) by rep/team Yes Limited Manual
Activity-to-outcome analysis (activities vs. pipeline/revenue) Yes Partial Manual
Rep productivity trends (daily/weekly/monthly) Yes Limited Manual
Follow-up and SLA monitoring (overdue tasks, response time) Yes Partial Manual
Drilldowns by rep, territory, account, and activity type Yes Limited Manual
Custom KPIs & dashboards Fully customizable Fixed Manual

Simple Pricing That Grows With You

Say goodbye to hidden costs, complex quotes, and pricing guesswork.

Clear ROI from Day One

No complicated quotes—just honest, value-driven pricing that delivers more for less, right from the start.

Built to Grow with You

From startup to scale-up, Bold BI grows with your business — no forced upgrades, just flexible, future-ready analytics.

Fits Every Budget

Whether you're a startup or an enterprise, our flexible pricing scales with your growth— Pay only for what you truly need.

Trusted & recognized

Analytics that wins awards and users.

Recognized by G2, TrustRadius and Visual Studio Magazine for delivering standout performance and value.

I appreciate Bold BI for making it easier to provide reporting for our customers, allowing both our analysts and customers to easily build and publish reports. The ability to build dashboards and modify queries for specific outcomes is very user-friendly. I value the mobile readiness of the app and its integration capabilities with API structures. The addition of AI features is impressive. The economic pricing model and the effective partnership, which includes consistent and helpful support, make it an invaluable tool for our OEM model.

Ravi S.

The support from Bold is unmatched. They do not charge extra for support and it is excellent anyway. All our tickets and questions are quickly answered with authoritative and precise guidance. This is important at the product is complex, powerful and mature. To get the most out of the tool, the level of support they provide is essential.

Murph M.

It was easy to implement data visualizations into our product. The standard widgets allowed us to build professional looking dashboards, and a robust API provided excellent control of the development and runtime process from within our application.

Scott Y.

RECOGNITION

Users Love Us

Visual Studio Reader's Choice - 2025

Leader - Fall 2025

High Performer - Fall 2025 EMEA

Regional Leader - Fall 2025 AMERICAS

TrustRadius Tech Cares

Capterra - 4.9/5

G2- 4.3/5

GetApp - 4.9/5

Software Advice - 4.4/5

Frequently Asked Questions

CRM reports focus on stored records, while a sales activity tracker connects activities, pipeline movement, and revenue across multiple data sources to provide deeper performance insights.
It improves performance by showing which activities drive results, highlighting gaps in rep engagement, and enabling data-driven coaching and pipeline optimization.
Yes. Many platforms allow dashboards to be embedded directly into CRMs or internal tools, so users don’t need to switch systems.
Yes. You can host the application in your environment for Windows, Linux, Docker, Kubernetes, and Azure App Service environments.
Yes. Drill down by region, product line, or rep to measure impact and coach effectively.
Yes Bold BI supports SSO, RBAC,and RLS, to protect sensitive sales data.
Ready to Get Started?

Start your 30-day free trial instantly

Easy integration, AI-Powered Dashboards and 24x5 real-time support.