
Pipedrive Sales Activities Dashboard
Understand sales activities to improve team productivity and sales outcomes.
The Sales Activities Dashboard helps teams analyze calls, meetings, tasks, and follow-up actions, enabling better activity planning, stronger accountability, and more effective sales execution.
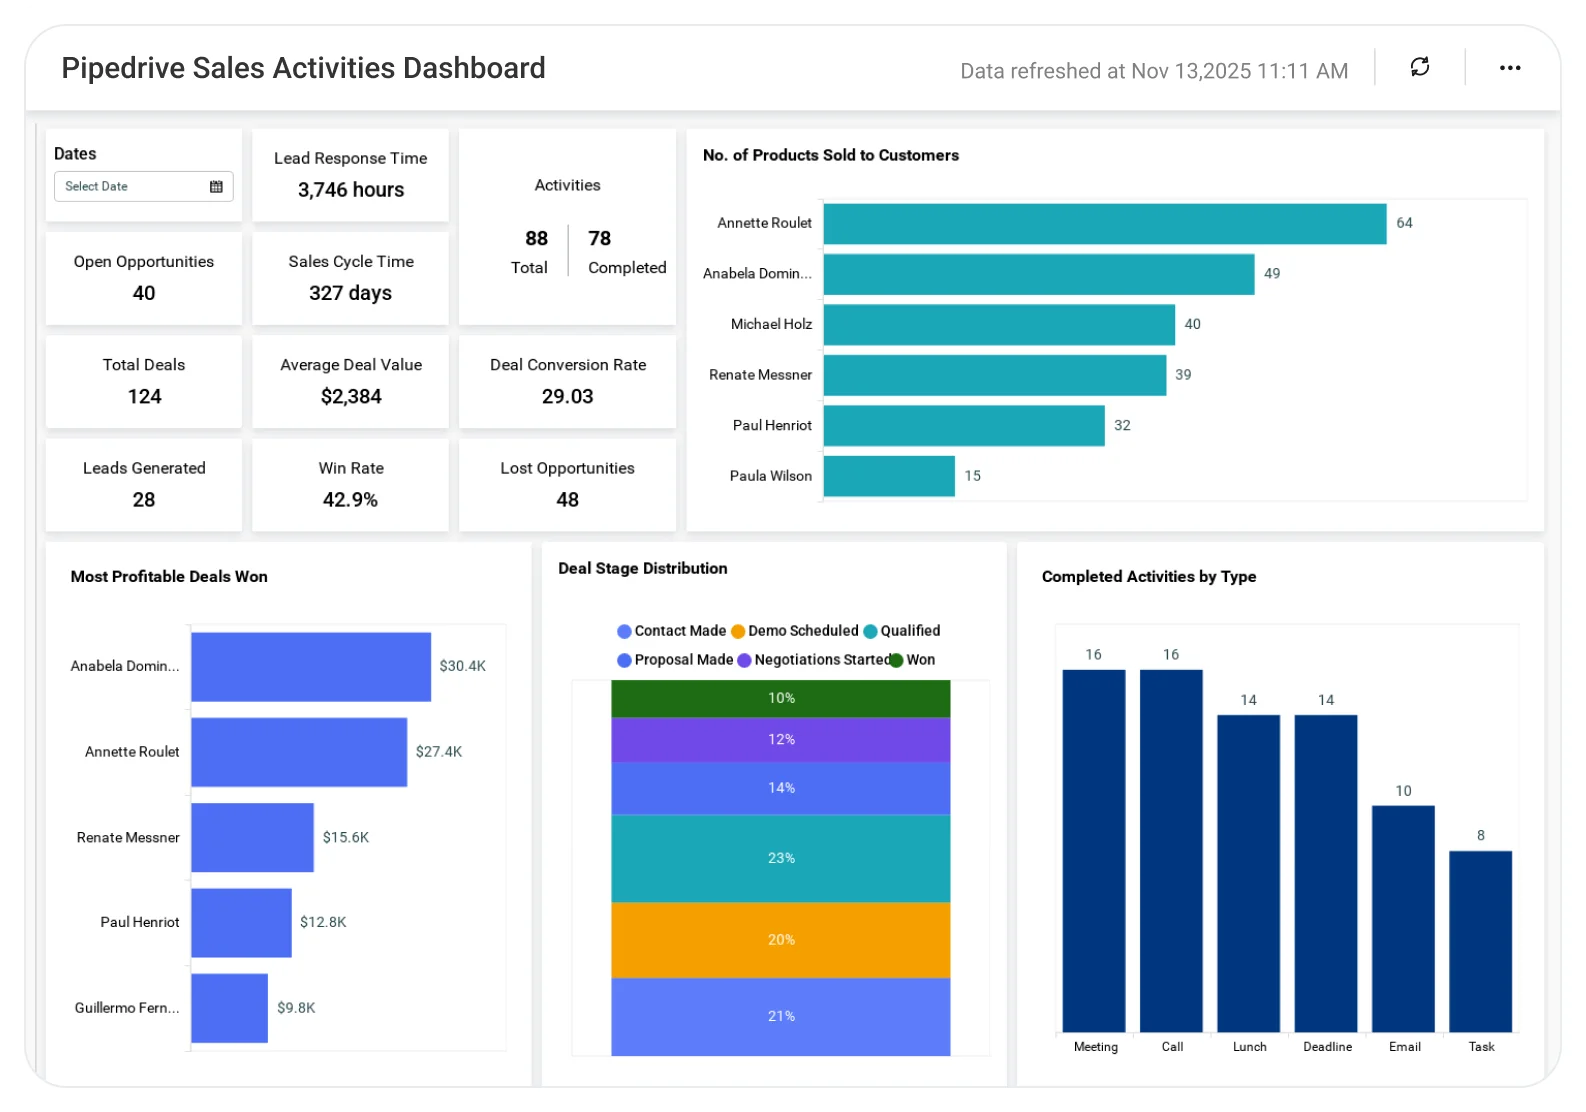
TL;DR
-
New contacts and companies added this month.
-
Email activity compared to last month.
-
Average deal size and average time to close.
-
Leads generated, open opportunities, and follow-up rates.
-
Deals by pipeline stage.
-
Top products sold and highest-value deals.
What Is a Sales Activities Dashboard?
A Sales Activities Dashboard is a visual analytics tool that tracks sales team actions, pipeline status, deal performance, and outreach effectiveness.
In Bold BI, it becomes an interactive, customizable dashboard that helps sales leaders monitor productivity, improve follow-ups, and drive consistent revenue growth.
Why Sales Activities Dashboard Matters
Consistent activity, timely follow-ups, and a healthy pipeline are the foundation of predictable sales performance.
Without a centralized view, sales leaders struggle to answer key questions like:
-
How many new contacts and companies are we adding?
-
Are our email and outreach efforts improving month over month?
-
How long does it take to close a deal and how large are those deals?
-
Where do deals stand in the pipeline right now?
What You’ll Track
Using Bold BI dashboards, you will track important project overview KPIs such as:
-
Sales activities & outreach: Monitor calls, meetings, emails, tasks, and follow-ups.
-
Pipeline & deal performance: Track deal size, time to close, and pipeline stage distribution.
-
Lead & Contact Growth: Measure new contacts, companies, leads, and opportunities.
-
Sales productivity trends: Compare activity levels and outcomes over time.
All dashboards are fully customizable, allowing you to add KPIs or metrics as needed.
How it Works
-
Apply the Sales Activities Dashboard sample.
-
Combine activities, deals, contacts, and performance metrics into a single, interactive dashboard.
-
Share dashboards securely with sales managers and executives.
-
Act on insights to improve productivity and pipeline health.
Why Bold BI Is the Right Fit for Pipedrive Sales Activities Analytics
-
High-volume sales activity tracking: Monitor leads, opportunities, closed deals, and pipeline without performance gaps.
-
Unified sales performance view: Track activities, pipeline, revenue, and deal metrics in one dashboard.
-
Deep conversion and deal analysis: Analyze conversion rates, deal velocity, win rate, and average deal size.
-
Flexible breakdowns and forecasting: Break down data by rep, region, product, or stage and forecast future sales.
-
Secure, embeddable deployment: Embed dashboards with enterprise-grade security in cloud or self-hosted environments.
Compare Options (at a glance)
| Feature | Bold BI | Pipedrive Built-in Reports | Spreadsheets |
|---|---|---|---|
| Activity volume by rep/team (calls, emails, meetings) | Yes | Limited | Manual |
| Activity completion & overdue tracking | Yes | Partial | Manual |
| Activities tied to outcomes (activity → deal progress/wins) | Yes | Limited | Manual |
| Pipeline coverage + activity pace (are you doing enough?) | Yes | Partial | Manual |
| Drilldowns by owner, team, pipeline, and activity type | Yes | Limited | Manual |
| Custom KPIs, targets, and dashboards | Fully customizable | Fixed | Manual |
Frequently Asked Questions
More Articles About Sales Activities Dashboard
-
How to Create a Dashboard for Sales Analysis in Bold BI
 This video will guide you through adding and configuring widgets on a sales analysis dashboard in Bold BI.


