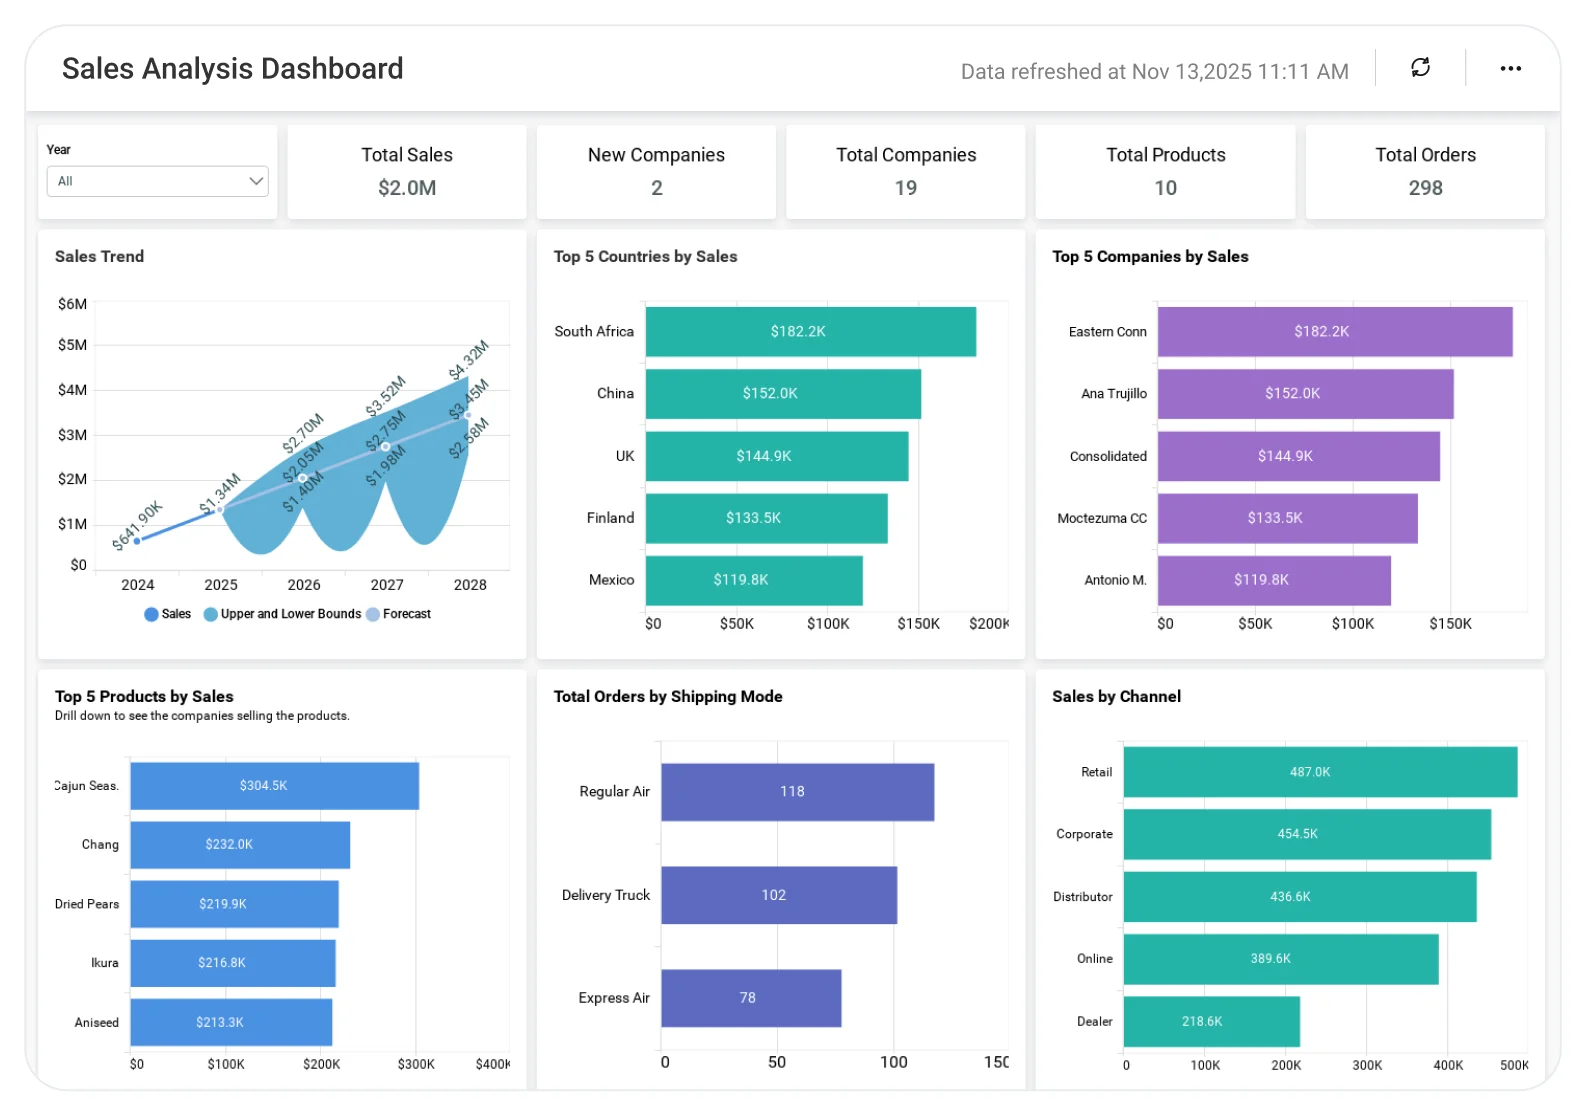
Sales Analysis Dashboard for Sales Managers
Understand sales trends and performance drivers to make informed revenue decisions.
The Sales Analysis Dashboard helps teams analyze sales performance, product-wise revenue, regional trends, and customer behavior, enabling better forecasting, improved strategy, and consistent sales growth.
TL;DR
-
Total sales by dollar amount with revenue trends.
-
Total sales by units sold.
-
Top-selling products and categories.
-
Country-level and regional sales distribution.
-
List ItemExecutive view: pipeline health, revenue patterns, and product contribution.
What Is a Sales Analysis Dashboard?
A Sales Analysis Dashboard provides a real time view of key sales metrics, including revenue, units sold, product performance, and regional trends, all presented in one interactive, easy to understand dashboard.
In Bold BI, this means automatically combining data from CRM, ERP, and ecommerce systems into dynamic visuals without relying on manual Excel reporting.
Why Sales Analysis Dashboard Matters
Stop guessing and manage your revenue with clarity and confidence.
When sales data is scattered across CRM, order management tools, and financial systems, your team is operatingoperates blindly. Bold BI gives you a single source of insights so you can answer core business-oriented questions instantly:
-
How much did we sell this month, quarter, or year?
-
How many total units were sold?
-
Which products are driving the most revenue?
-
Which regions are performing as compared to others?
This clarity enables you to monitor your teams more effectively, allowing leadership to make more informed strategic decisions.
What You’ll Track
-
Total sales by revenue: See overall sales, monthly/quarterly performance, growth rate, and how you track goals.
-
Total sales by units sold: Understand product and category demand, volume trends, and high- vs. low-selling items.
-
Sales by country: Compare global performance with country-level revenue, units sold, heatmaps, and regional growth trends.
All dashboards are fully customizable, allowing you to add KPIs, adjust targets, or combine data from products, regions, and sales teams.
How It Works
Why Bold BI Is the Right Fit for Sales Analytics
-
Unified sales data: Combine CRM, ERP, e-commerce, and finance data into one governed dashboard.
-
Real-time performance visibility: Get up-to-date insights for accurate forecasting and territory health.
-
Deep drilldowns: Analyze performance from global views down to products, reps, regions, and individual transactions.
-
Secure, governed analytics: Control access with Row Level Security, Single Sign On, and Role Based Access Control.
-
Embedded sales analytics: Embed dashboards directly into CRM systems, portals, or executive workspaces.
-
Flexible deployment: Deploy in the cloud or self-hosted environments based on business needs.
Compare Options (at a glance)
| Feature | Bold BI | CRM Built-in Reports | Spreadsheets |
|---|---|---|---|
| Revenue & sales trend tracking (MoM/YoY) | Yes | Limited | Manual |
| Pipeline & forecast visibility (by stage/rep/region) | Yes | Limited | Manual |
| Quota attainment & rep performance | Yes | Partial | Manual |
| Deal drilldowns (product, customer, channel, region) | Yes | Limited | Manual |
| Custom KPIs & dashboards | Fully customizable | Fixed | Manual |
Frequently Asked Questions
More Articles About Sales Analysis Dashboard
-
Boost Your Sales with Embedded Analytics:
This blog explains how embedded analytics can transform sales performance by integrating data visualization and analytical tools directly into sales applications. This empowers managers to make informed decisions, optimize pricing, and predict future sales, ultimately boosting productivity and profitability.
-
Unlocking Sales Success: Using Sales Funnel Analysis:
This blog focuses on how analysing the sales funnel can enhance overall sales performance. Learn how sales funnel analysis reveals drop-offs and boosts conversions, complementing insights from the Sales Analysis Dashboard.
-
How to Create a Dashboard for Sales Analysis in Bold BI:
This video will guide you through adding and configuring widgets on a sales analysis dashboard in Bold BI. It also includes setting up the combo box, bar chart, spline chart, doughnut chart, and grid widgets.