
HubSpot Deals Report Dashboard for Sales Teams
Understand deal progress and pipeline health to improve conversions and revenue predictability.
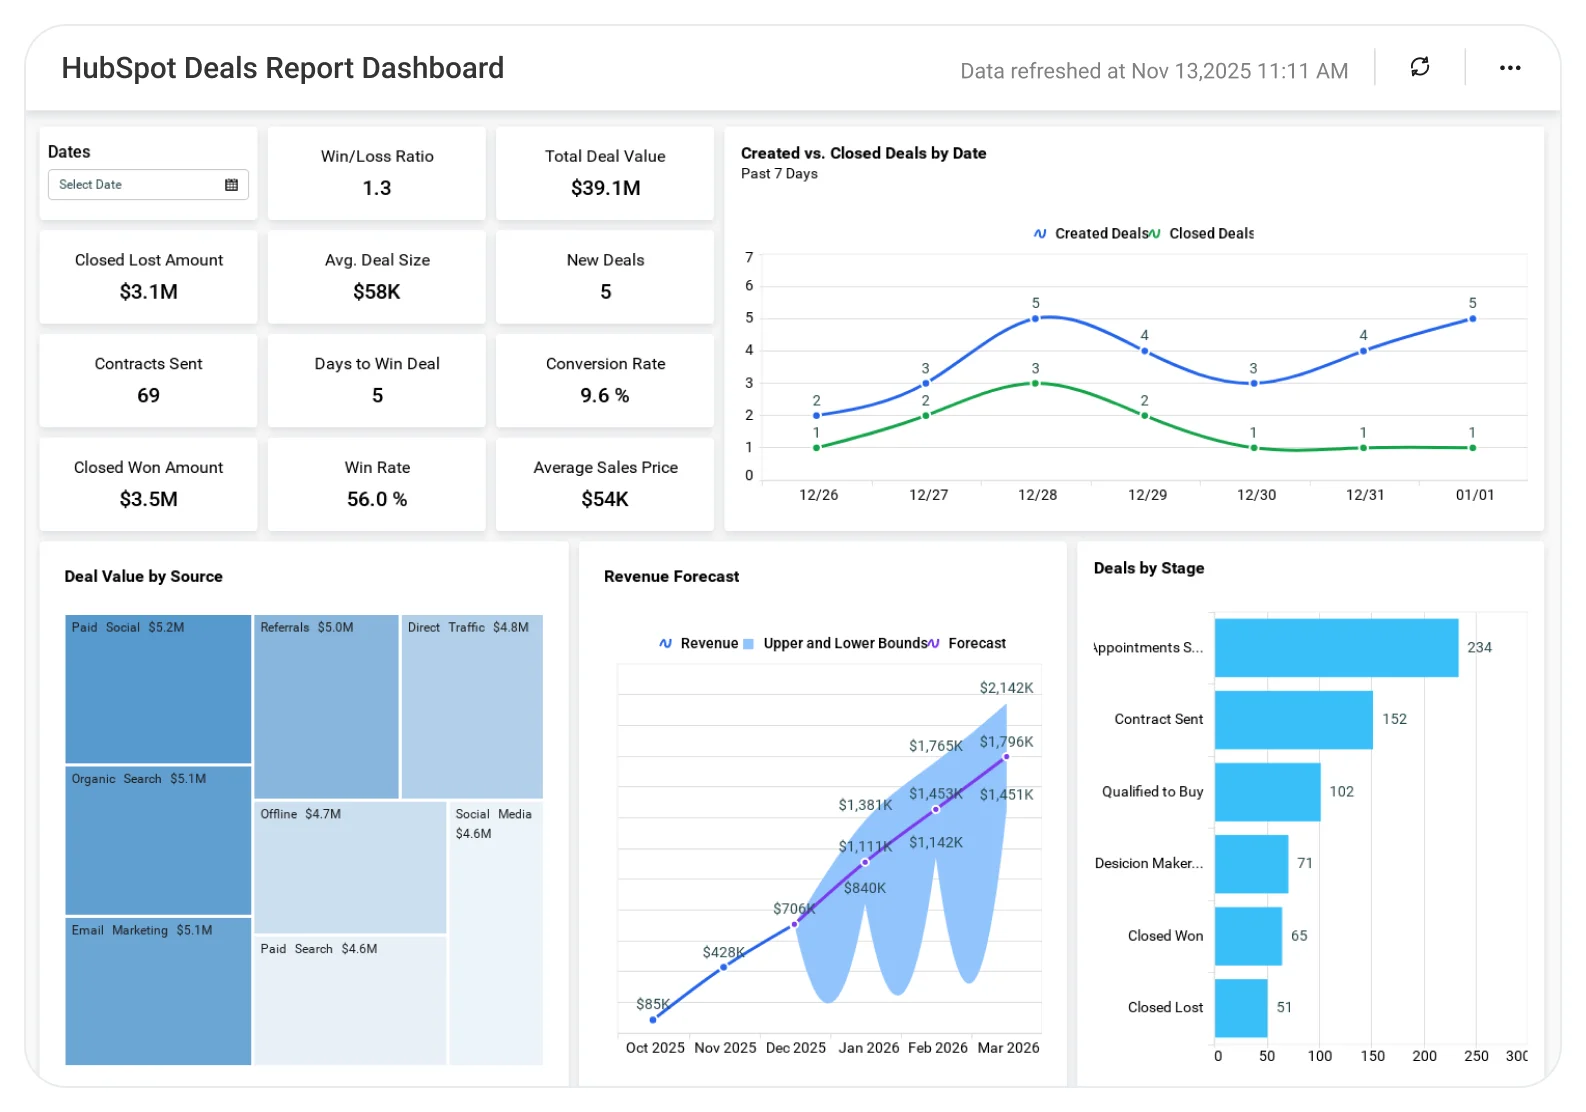
The HubSpot Deals Dashboard helps sales teams analyze deal stages, pipeline value, win-loss trends, and sales velocity, enabling better prioritization, accurate forecasting, and faster deal closures.
TL;DR
A single, executive-ready snapshot of HubSpot deal performance is available at a glance.
-
Total deals won and lost.
-
Average deal size and days to close.
-
Win rate, loss rate, and conversion rate.
-
Revenue forecast with upper and lower bounds.
-
Deal distribution by type, priority, and source.
-
Funnel view of opportunities by pipeline stage.
What Is a HubSpot Deals Report Dashboard?
A HubSpot Deals Report Dashboard is a visual analytics tool that tracks deal performance, pipeline health, win rates, and revenue forecasts using HubSpot CRM data.
In Bold BI, it becomes an interactive, customizable dashboard that helps sales teams understand performance trends, prioritize opportunities, and forecast revenue with confidence.
Why HubSpot Deals Report Dashboard Matters
Sales leaders need more than raw CRM data; they need context, trends, and forecasts.
Without a consolidated dashboard, it becomes difficult to answer questions like:
-
How many deals have we actually won?
-
Is our average deal size improving?
-
What is our win/loss ratio and why?
-
Are we on track to hit future revenue targets?
The HubSpot Deals Report Dashboard answers these questions in one place, helping sales leaders act with clarity and confidence.
What You’ll Track
-
Deal performance & outcomes: Deals won, lost, and in progress to understand sales effectiveness.
-
Deal value & efficiency: Track average deal size and average time to close.
-
Pipeline & priority insights: Analyze opportunities by stage, type, and priority.
-
Win & conversion rates: Win rate and conversion performance to measure sales efficiency.
-
Revenue trends & forecasting: Compare historical revenue with future projections.
All dashboards are fully customizable, allowing you to add KPIs or metrics as needed.
How It Works
-
Connect your HubSpot CRM data.
-
Apply the HubSpot Deals Report Dashboard sample.
-
Blend deal, pipeline, and revenue metrics.
-
Share dashboards securely with sales leaders and executives.
-
Act on insights to improve close rates and revenue predictability.
Why Bold BI Is the Right Fit for HubSpot Deals Report Analytics
-
Centralize deal and pipeline reporting: Combines deal status, value, win rates, and revenue trends in one view.
-
Support pipeline and performance analysisAnalyze deals by stage, priority, source, and time period.
-
Deploy flexibly: Use Bold BI in cloud or self-hosted environments based on business needs.
-
Enable interactive drilldowns: Explore performance from high-level KPIs down to individual deals.
Compare Options (at a glance)
| Feature | Bold BI HubSpot Deals Report Dashboard | HubSpot Native Deal Reports | Spreadsheets |
| Deal pipeline & stage tracking | Yes | Yes | Manual |
| Revenue forecasting & deal value trends | Yes | Limited | Manual |
| Win/loss & conversion rate analysis | Yes | Limited | Manual |
| Sales rep & team performance insights | Yes | Limited | Manual |
| Executive-ready dashboards | Yes | Limited | No |
Frequently Asked Questions
More Articles About HubSpot Deals Report Dashboard
-
Maximizing Sales Potential: HubSpot Deals Analysis with BI
 Explains how analyzing HubSpot deal data with BI dashboards helps sales teams improve win rates, forecast revenue, and gain deeper visibility into pipeline performance.


