
Pipeline CRM Deals Analysis Dashboard
Understand deal progress and pipeline flow to improve sales conversions.
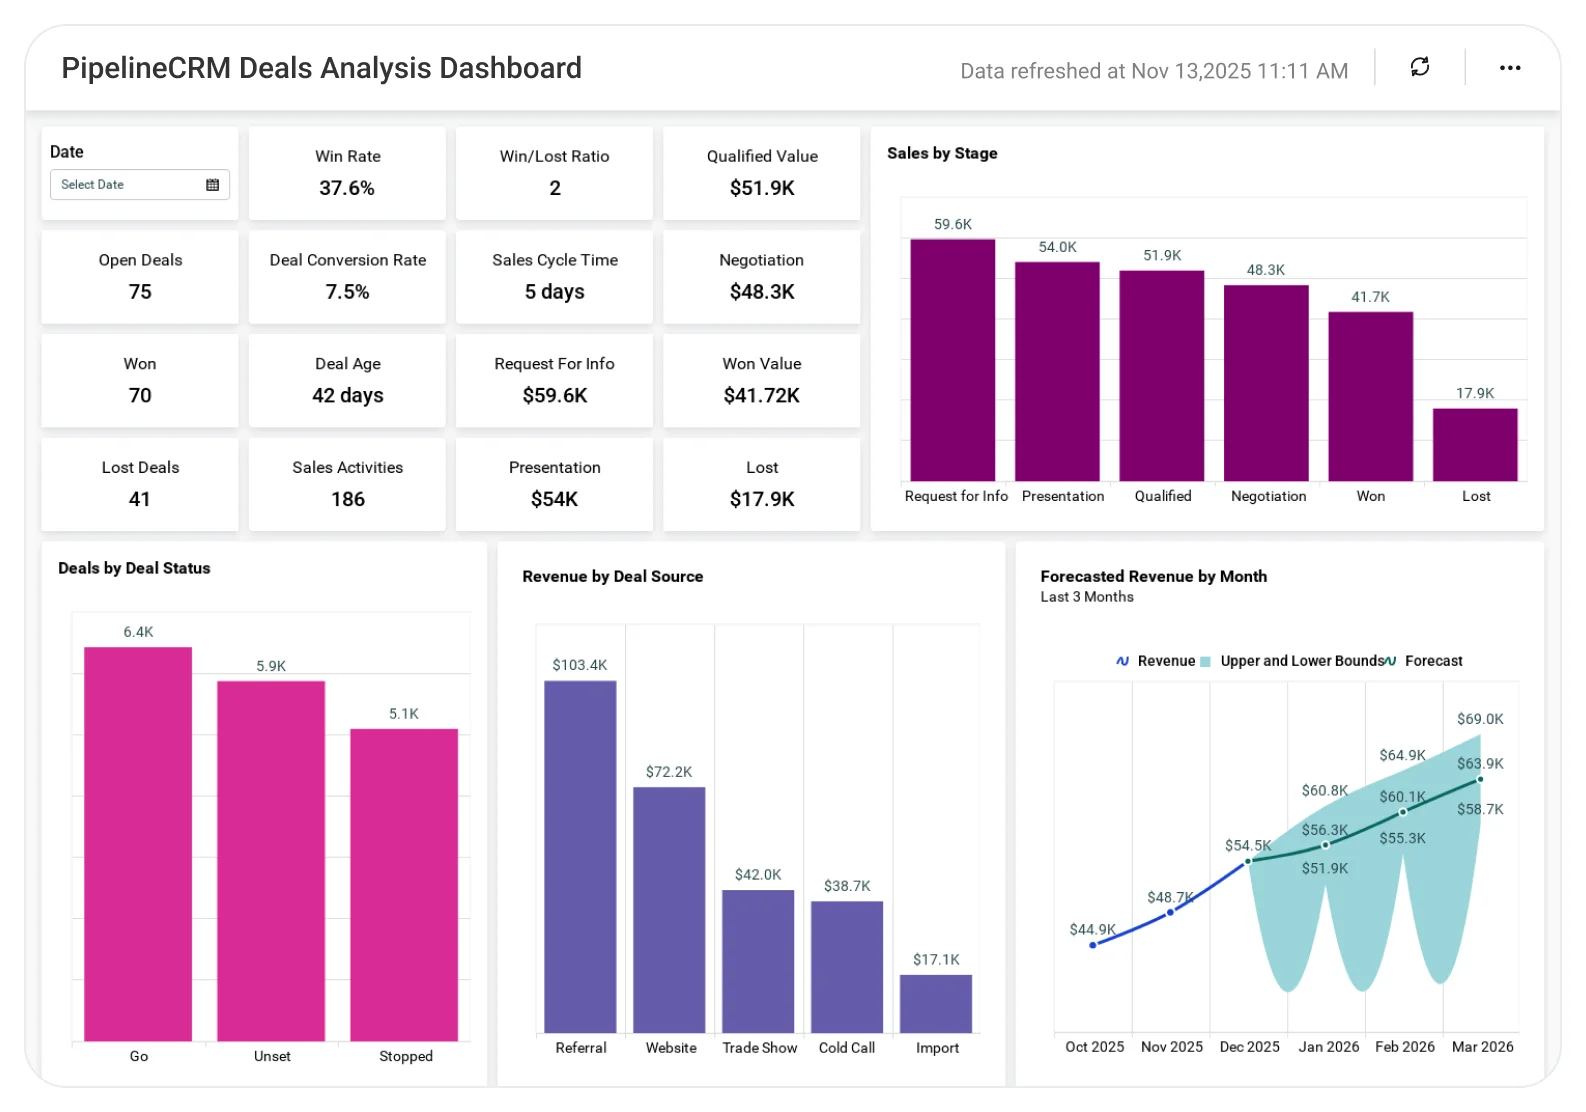
The Pipeline CRM Deals Dashboard helps sales teams analyze deal stages, pipeline value, and sales progress, enabling better prioritization, clearer forecasting, and more effective deal management.
TL;DR
-
Total deals and pipeline value.
-
Deals by stage and status.
-
Win and loss trends.
-
Average deal size and sales cycle.
-
Sales rep and stage-wise performance.
What Is a Pipeline CRM Deals Analysis Dashboard?
A Pipeline CRM Deals Analysis Dashboard is a visual analytics solution that helps sales teams track deal progression, pipeline value, and conversion rates across stages and time periods.
In Bold BI, it becomes an interactive dashboard with KPIs, charts, and filters, automatically updated from CRM data sources.
Why Pipeline CRM Deals Analysis Dashboard Matters
Sales pipelines change constantly, and small delays can impact revenue forecasts.
Without a centralized pipeline dashboard:
-
Deal slippage goes unnoticed.
-
Forecast accuracy suffers.
-
Sales efforts lack focus.
Bold BI brings pipeline data into one dashboard, so teams can monitor deal progress, prioritize opportunities, and improve close rates.
What You’ll Track
-
Pipeline overview: Total number of deals and overall pipeline value.
-
Deal stage distribution: Deals categorized by pipeline stages to identify bottlenecks.
-
Win & loss performance: Closed-won and closed-lost deals to assess conversion efficiency.
-
Deal value & sales cycle: Average deal size and time taken to close deals.
-
Sales performance insights: Deal performance by sales representative, stage, or time period.
All dashboards are fully customizable, allowing you to add KPIs or metrics as needed.
How It Works
-
Select the Pipeline CRM Deals Analysis Dashboard sample.
-
Blend deal stages, deal values, win/loss status, and sales cycle data in one view.
-
Share role-based dashboards with sales managers, revenue leaders, and executives.
-
Monitor pipeline health, identify stalled deals, and improve forecasting and close rates.
Why Bold BI Is the Right Fit for PipelineCRM Deals Analytics
-
Centralize pipeline visibility: Combines deal stages, values, and outcomes in one view.
-
Improve revenue forecasting: Enables pipeline-based forecasting using real-time data.
-
Enable actionable sales insights: Designed for stage-level, rep-level, and time-based analysis.
-
Deploy flexibly: Supports cloud and self-hosted deployment for sales organizations.
Compare Options (at a glance)
| Feature | Bold BI Pipeline CRM Dashboard | CRM Reports | Spreadsheets |
| Pipeline value tracking | Yes | Limited | Manual |
| Deal stage analysis | Yes | Limited | Manual |
| Win/loss insights | Yes | Limited | Manual |
| Sales forecasting support | Yes | Limited | No |
| Executive-ready dashboards | Yes | Limited | No |
Frequently Asked Questions
More Articles About CRM & Sales Pipeline Analytics
-
Visualize Sales Metrics with a Zoho CRM Sales Dashboard
 Explains how sales dashboards help teams analyze deal stages, pipeline value, win rates, and sales performance using CRM data for better forecasting and decision-making.
-
Boost Your Sales with Embedded Analytics
Shows how embedding analytics into CRM and sales tools gives teams real-time visibility into pipeline health, deal performance, and revenue trends without switching platforms.


