Revenue Analysis Dashboard
Understand revenue trends and drivers to improve sales performance and growth.
The Revenue Analysis Dashboard helps teams analyze revenue by product, region, customer, and time period, enabling better forecasting, informed strategy decisions, and sustained revenue growth.
TL;DR
-
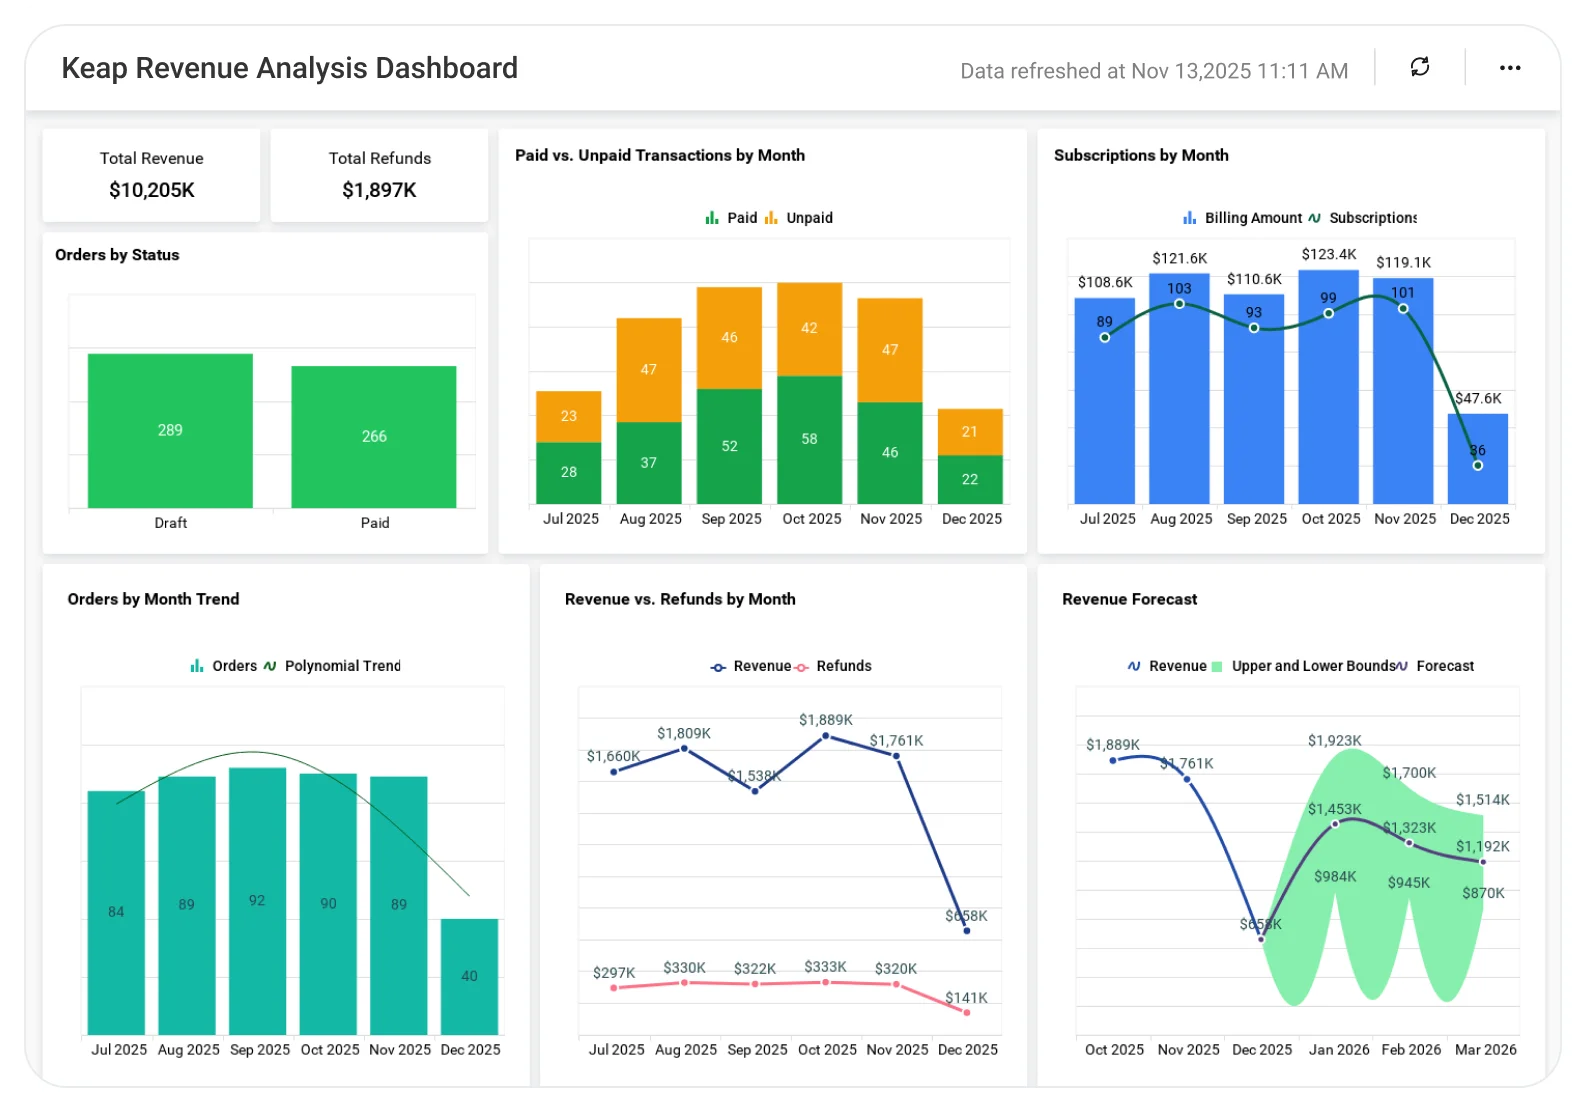
Orders placed over the past six months.
-
Revenue compared with refunds.
-
Paid vs unpaid order trends.
-
Subscription count and subscription revenue value.
-
High-performing sales days and monthly patterns.
What Is a Revenue Analysis Dashboard?
A Revenue Analysis Dashboard is a visual analytics tool that tracks orders, revenue, refunds, and subscription income over time.
In Bold BI, it becomes an interactive dashboard that allows teams to monitor current performance, analyze historical trends, and evaluate revenue quality without manual spreadsheets.
Why Revenue Analysis Dashboard Matters
Revenue growth depends on knowing what’s earned, what’s refunded, and what’s recurring without guesswork.
Without a centralized revenue dashboard:
-
Refund impact is harder to measure.
-
Subscription value lacks visibility.
-
Monthly targets are harder to forecast.
Bold BI brings all revenue signals into one clear view so teams can stay on track, spot risks early, and plan growth with confidence.
What You’ll Track
-
Order volume trends: Monitor how many orders customers placed over the past six months to understand demand patterns.
-
Revenue vs refunds: Compare total revenue with refunds to evaluate net revenue impact.
-
Payment status insights: Track paid versus unpaid orders to assess cash flow health.
-
Subscription revenue value: Analyze active subscriptions and their contribution to recurring revenue.
All dashboards are fully customizable, allowing you to add KPIs or metrics as needed.
How It Works
-
Connect your order and subscription data from your sales systems.
-
Apply the Revenue Analysis dashboard sample.
-
Review current-month performance alongside six-month trends.
-
Spot your highest-performing sales days and uncover refund-driven revenue leakage.
-
Share dashboards with finance and sales leaders.
Why Bold BI is the Right Fit for Keap Revenue Analytics
-
One dashboard for orders, revenue, refunds, and subscriptions.
-
Clear month-over-month and long-term trend visibility.
-
Interactive visuals for faster decision-making.
-
Secure access with Single Sign On, Role Based Access Control and Row Level Security.
-
Cloud or self-hosted deployment flexibility.
Compare Options (at a glance)
| Feature | Bold BI | Accounting / ERP Reports | Spreadsheets |
| Revenue trend analysis | Yes | Limited | Manual |
| Multi-source revenue integration | Yes | Limited | Manual |
| Product / region-wise revenue breakdown | Yes | Limited | Manual |
| Forecasting & growth insights | Yes | Limited | No |
| Executive-ready dashboards | Yes | Limited | No |
Frequently Asked Questions
More Articles About Revenue Analysis Dashboard
-
Maximize Insurance Company’s Revenue with Embedded Analytics
This blog explains how embedded analytics with Bold BI helps insurance companies track revenue, policy performance, and risk metrics through interactive dashboards to drive smarter, data-driven decisions.
-
Visualizing Success: Maximizing Hotel Revenue Through Data Insights
This blog explains how data insights and visualization help hotels boost revenue by understanding customer preferences, optimizing pricing and promotions, improving marketing strategies, and tracking key performance metrics like bookings, occupancy, and revenue performance.
-
Boost Your Revenue by Analyzing Ticket Sales Using Embedded Analytics
This blog explains how analyzing ticket sales data can help businesses improve sales performance by tracking key metrics such as total sales, revenue trends, customer buying patterns, and event performance, enabling data-driven decisions that boost overall profitability.