
Northwind Products and Suppliers Dashboard
Understand product and supplier performance to improve purchasing and sales decisions.
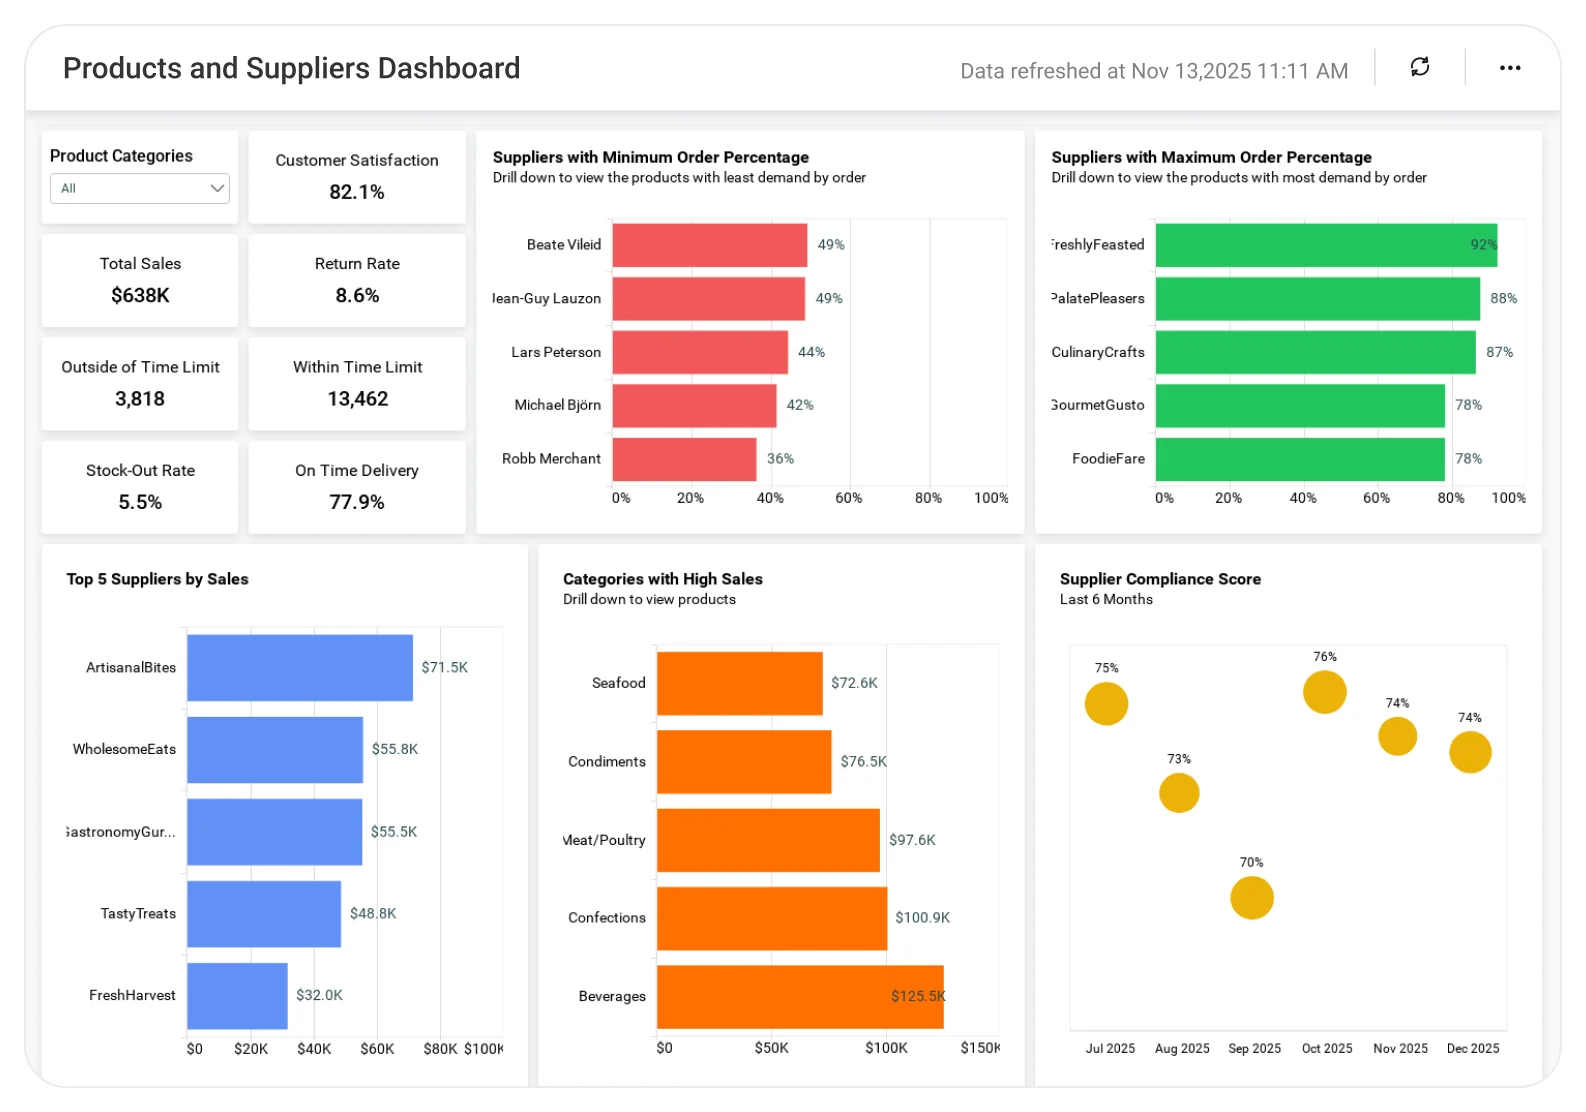
The Northwind Products and Suppliers Dashboard helps teams analyze product performance, supplier contribution, and sales trends, enabling better supplier selection, inventory planning, and data-driven business decisions.
TL;DR
-
Total sales value across all orders.
-
Sales contribution by product and category.
-
Best- and worst-performing products.
-
Customers with the highest order volume.
-
Regional distribution of sales.
What Is a Northwind Products and Suppliers Dashboard?
A Products and Suppliers Dashboard is a visual analytics tool that tracks sales performance by product, customer, and region.
In Bold BI, it becomes an interactive dashboard with drilldowns and filters that let users explore sales trends, customer behavior, and product performance without manual analysis.
Why Northwind Products & Suppliers Dashboard Matters
Understanding what sells, and to whom, is essential for inventory planning, pricing strategy, and customer targeting.
Without a consolidated sales dashboard:
-
Demand trends are harder to identify.
-
Inventory decisions rely on assumptions.
-
Regional sales opportunities are missed.
Bold BI brings product, customer, and regional sales data together so teams can align inventory and strategy with real demand.
What You’ll Track
-
Overall sales performance: Monitor total sales value and order activity across all products.
-
Product & category insights: Analyze sales by product category and drilldowns to individual product performance.
-
Customer ordering behavior: Identify top customers, what they order, and how frequently they purchase.
-
Regional sales distribution: View how sales are spread across different customer locations and regions.
All dashboards are fully customizable, allowing you to add KPIs or metrics as needed.
How It Works
-
Load the Northwind sample dataset.
-
Apply the Products and Suppliers dashboard.
-
Use drilldowns to explore categories and products.
-
Filter data by product category for focused analysis.
-
Share dashboards or embed them internally.
Why Bold BI Is the Right Fit for Northwind Products and Suppliers Analytics
-
Multi-level drilldowns for product and customer analysis.
-
Interactive maps for regional sales visibility.
-
Simple filtering without complex queries.
-
Secure access with Single Sign On, Role Based Access Control and Row Level Security.
-
Cloud or self-hosted deployment flexibility.
Compare Options (at a glance)
| Feature | Bold BI | ERP / Inventory Reports | Spreadsheets |
| Product & supplier performance tracking | Yes | Limited | Manual |
| Category-wise product analysis | Yes | Limited | Manual |
| Supplier contribution & dependency insights | Yes | Limited | No |
| Inventory & reorder trend visibility | Yes | Limited | Manual |
Frequently Asked Questions
More Articles About Northwind Products and Suppliers Dashboard
-
Expand Sales with Embedded Product & Supplier Insights
 Embedded analytics enables sales teams to track customer purchases, buying trends, and supplier performance through in-app dashboards, helping businesses forecast demand, optimize supply, and strengthen customer relationships.


