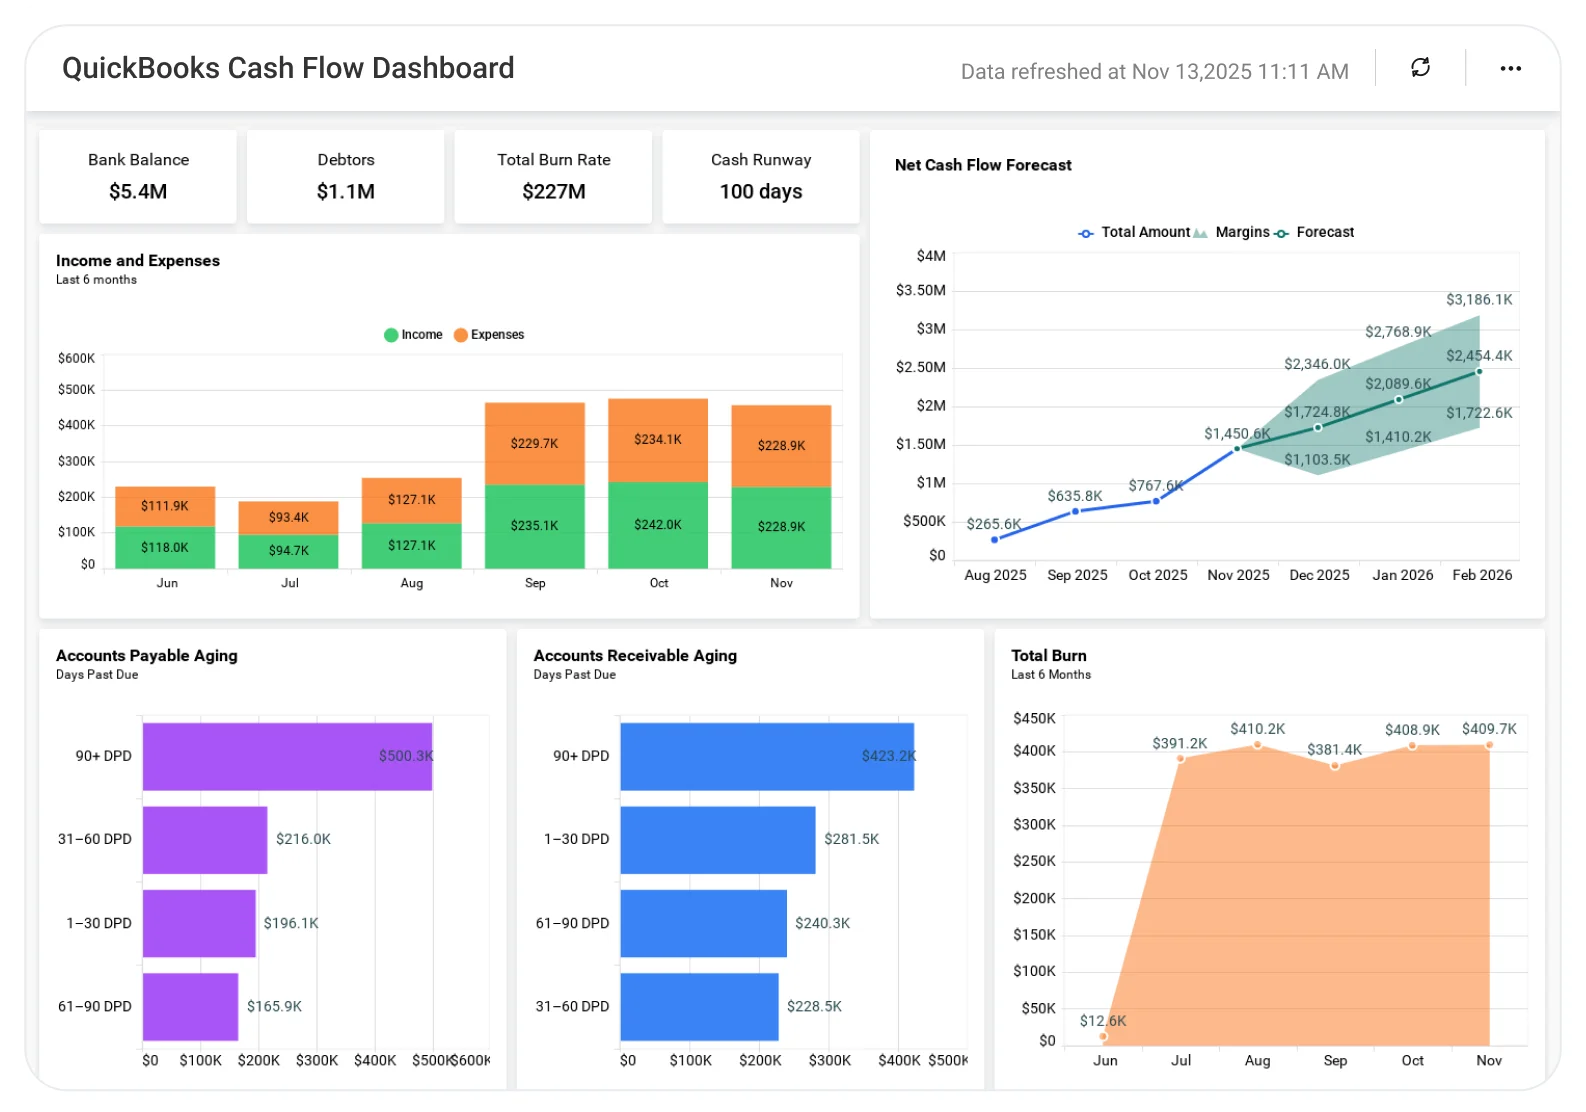
QuickBooks Cash Flow Dashboard
Track QuickBooks cash inflows, outflows, and balances in one dashboard to improve cash flow planning.
The QuickBooks Cash Flow Dashboard gives finance teams and business owners a single view of cash inflows, outflows, and balances, enabling them to plan more effectively, act sooner, and maintain healthier cash flow.
TL;DR
-
Track cash inflow and outflow trends to understand how money moves through the business.
-
Monitor daily and monthly cash balance changes to maintain liquidity visibility.
-
Identify upcoming cash surplus and shortfall periods to plan proactive actions.
-
Analyze income and expense drivers by category to control spending and improve collections.
-
Support confident financial planning and decision-making with data-driven cash flow insights.
What Is a QuickBooks Cash Flow Dashboard?
A QuickBooks Cash Flow Dashboard is an analytics solution that helps businesses understand how money moves in and out of the organization over time.
In Bold BI, this dashboard connects directly with QuickBooks data to consolidate income, expenses, and balances, supporting informed decisions around spending, collections, and financial planning.
Why QuickBooks Cash Flow Dashboard Matters
Cash flow health is critical for day-to-day operations and long-term business growth.
When cash data is reviewed only through basic accounting views:
-
Shortfalls are identified too late.
-
Spending decisions lacks context.
-
Payment timing issues go unnoticed.
-
Financial planning becomes reactive.
A centralized dashboard helps businesses spot cash issues earlier, understand what drives them, and manage cash flow proactively instead of reacting after problems appear.
What You’ll Track
Using Bold BI dashboards, you will track important KPIs such as:
-
Cash inflow trends: Incoming cash from sales and payments to understand revenue timing.
-
Cash outflow patterns: Expense and payment trends to monitor spending behavior.
-
Net cash position: Daily and monthly cash balance changes to clearly assess liquidity and runway.
-
Category-wise cash impact: Contribution of income and expense categories to identify key cash drivers.
All dashboards are fully customizable, allowing you to add KPIs or metrics as needed.
How It Works
-
Connect your QuickBooks account data to Bold BI.
-
Apply the QuickBooks Cash Flow Dashboard sample.
-
Combine income, expense, and balance data in one unified view.
-
Analyze insights by account, category, or time period.
-
Share dashboards with finance teams and business leaders.
Why Bold BI Is the Right Fit for QuickBooks Cash Flow Analytics
-
Unified cash visibility: View all QuickBooks cash inflows, outflows, and balances in one dashboard.
-
Centralized financial analysis: Evaluate inflows, outflows, and balances together.
-
Comparative insights: Compare periods or categories to identify cash flow changes.
-
Actionable drilldowns: Investigate sudden expense spikes or delayed inflows in detail.
-
Flexible deployment: Deploy dashboards in cloud or self-hosted environments to fit finance workflows.
Compare Options (at a glance)
| Feature | Bold BI | QuickBooks Reports | Spreadsheets |
| Cash flow analytics | Yes | Limited | Manual |
| Inflow & outflow trend insights | Yes | Partial | Manual |
| Category-wise cash analysis | Yes | Limited | Manual |
| Balance forecasting visibility | Yes | Limited | No |
| Custom KPIs & drilldowns | Fully customizable | Fixed | Manual |
Frequently Asked Questions
More Articles About QuickBooks Cash Flow
-
Top 10 Finance Dashboards for Global Businesses
Presents 10 prebuilt financial dashboard templates (e.g., balance sheet, budget vs. actual, CFO dashboard) with real-world use cases for global finance teams seeking centralized, multi-market insights.
-
Empower Finance Departments with Embedded Analytics
Demonstrates how embedded BI tools can enhance finance operations post-COVID by enabling real-time monitoring of cash flow, AR/AP turnover, liquidity ratios, risk metrics, and budget management directly inside core systems.
-
Financial Charts & Graphs for Effective Visualization
Provides insights on using charts (e.g., line, bar, pie) for visualizing financial trends, profit margins, sales performance, and expense allocations, perfect for designing impactful finance dashboards.