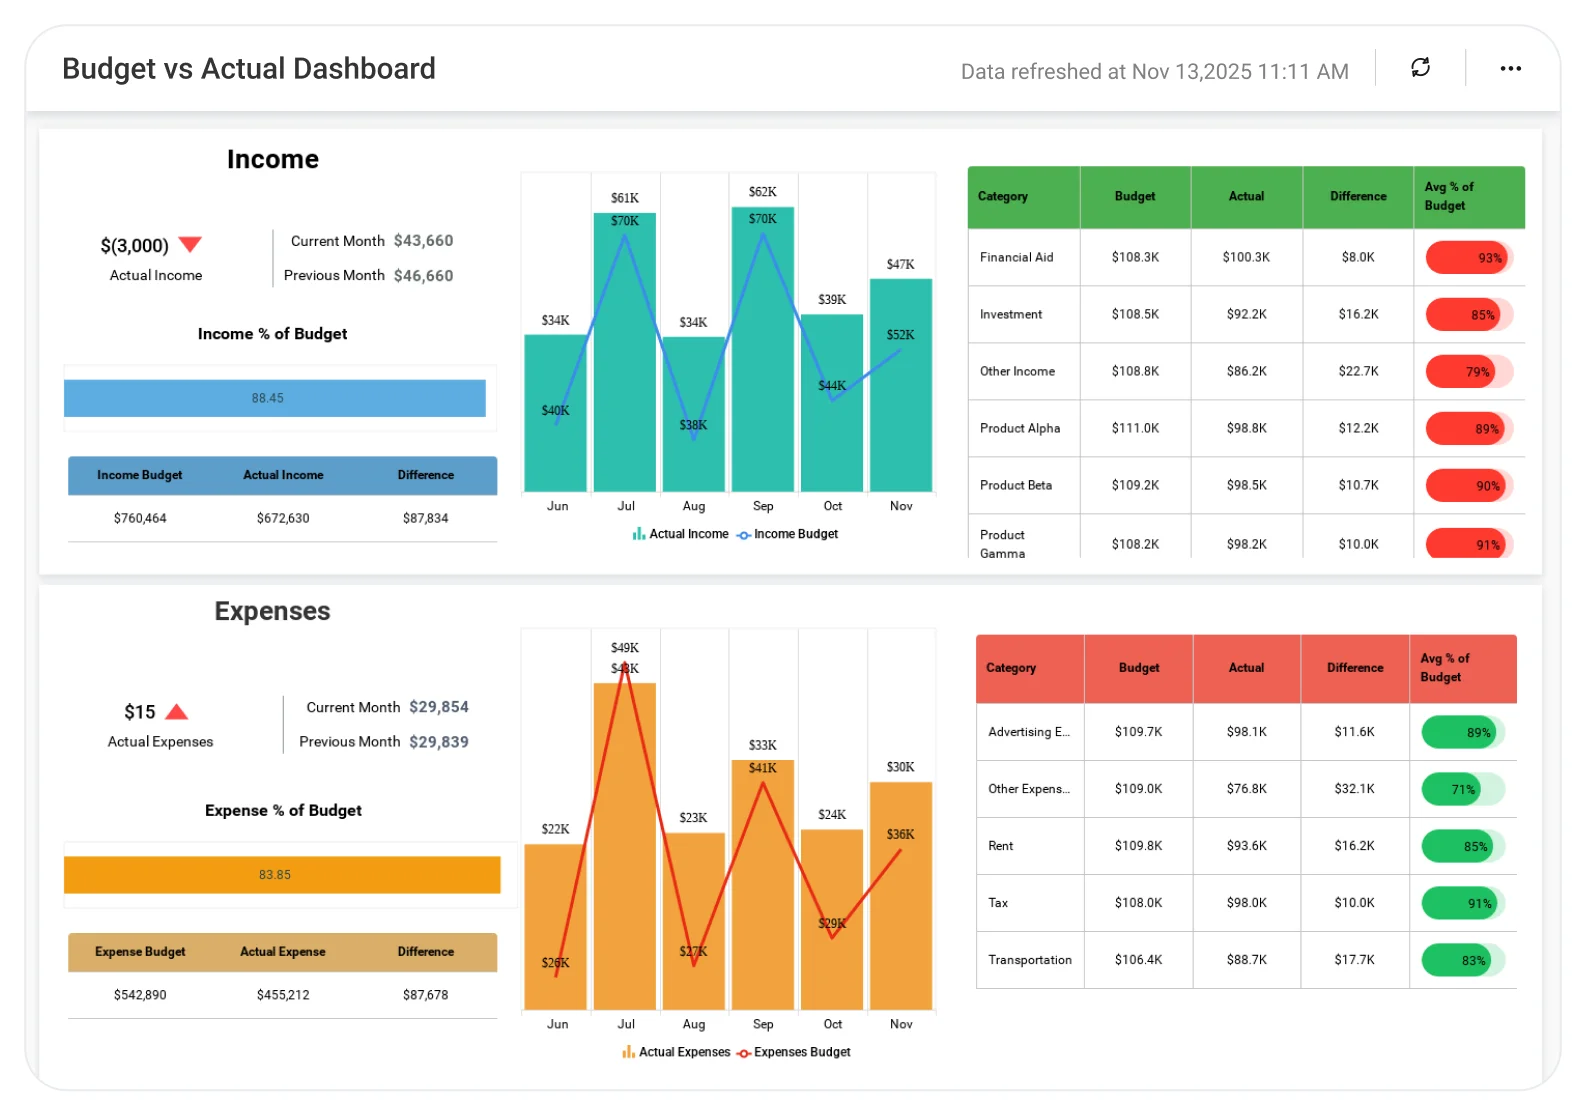
Budget vs Actual Dashboard for Finance Teams
Understand budget performance by comparing planned spending with actual expenses.
The Budget vs Actual Dashboard helps finance teams analyze budget allocations, actual costs, and variances, enabling better cost control, accurate forecasting, and informed financial decision-making.
TL;DR
-
Real-time budget vs. actual comparison for income and expenses.
-
6-month financial trend analysis for forecasting and long-term planning.
-
Category-level breakdowns to identify cost drivers and revenue patterns.
-
Executive view of financial stability, efficiency, and goal alignment.
What Is a Budget vs Actual Dashboard?
A Budget versus Actual Dashboard visually compares budgeted and actual financial results for tracking performance and guide future budgeting cycles.
In Bold BI, this means interactive charts showing income, expenses, trends, and category-level variance all updated in real time.
Why a Budget vs Actual Dashboard Matters
Financial stability starts with visibility. When budget data is locked in databases or spreadsheets, it is more challenging to understand trends, identify overspending, or assess whether revenue goals are realistic.
Bold BI gives finance teams one source of financial truth, helping them answer:
-
How much income have we actually earned?
-
What are our true operating expenses?
-
Are we trending above or below budget over time?
-
Which categories are driving revenues compared to others?
This is essential to Finance leaders as it helps you quickly identify risks, validate assumptions, and steer the business with confidence.
What You’ll Track
Using Bold BI dashboards, you will track important KPIs such as:
-
Income performance: Monitor how your actual income compares to budget, month-to-month trends and category contributions.
-
Expense performance: See where your spending sits vs. budget and which areas are driving spikes.
-
Category insights: Understand a clear breakdown of income and expenses by category, including variances and contribution.
-
Budget accuracy & risk signals: Spot overspending, underspending, and emerging financial risks across teams or departments.
-
Financial trends & planning support: Review long-term revenue and expense patterns to improve future budgeting and forecasting accuracy.
-
Customizable KPIs: Tailor dashboards by adding KPIs, adjusting thresholds, and connecting data from any department to stay aligned with organizational goals.
How It Works
Why Bold BI Is the Right Fit for Budget vs Actual Analytics
-
Combine ERP + accounting systems + spreadsheet data into one governed dashboard.
-
Automate variance analysis and eliminate manual updates.
-
Drill from summary insights to monthly or category-level details.
-
Flexible deployment in cloud or self-hosted environments.
-
Embedding capabilities of the dashboards for internal finance portals and executive workspaces.
Compare Options (at a glance)
| Feature | Bold BI | ERP / Accounting Reports | Spreadsheets |
|---|---|---|---|
| Budget vs actual analysis by period/entity | Yes | Limited | Manual |
| Variance (amount & %) with drilldowns | Yes | Partial | Manual |
| Department/cost center & GL account breakdowns | Yes | Limited | Manual |
| Forecasting and rolling budgets | Yes | Limited | Manual |
| Custom KPIs & dashboards | Fully customizable | Fixed | Manual |
Frequently Asked Questions
More Articles About Budget vs. Actual Dashboard
-
Empower Finance Departments with Embedded Analytics
This blog explains how embedded analytics improves financial management by integrating dashboards into everyday workflows. Shows how embedding the Budget vs. Actual Dashboard enables real-time financial insights for better decision-making.
-
Top 10 Finance Dashboards for Global Businesses
This blog highlights ten powerful finance dashboard examples designed for global businesses. It serves as a guide for selecting and implementing dashboards that improve efficiency and transparency in global finance operations.
-
How to Build a Budget vs. Actual Dashboard in Bold BI
This video will guide you through adding and configuring widgets on a budget versus actual dashboard in Bold BI. It includes setting up the text, KPI cards, a radial gauge, column charts, and grid widgets.