
Harvest Financial and Invoicing Insights Dashboard
Improve cash flow predictability, increase billing accuracy, and support faster financial decisions with unified invoicing and revenue insights.
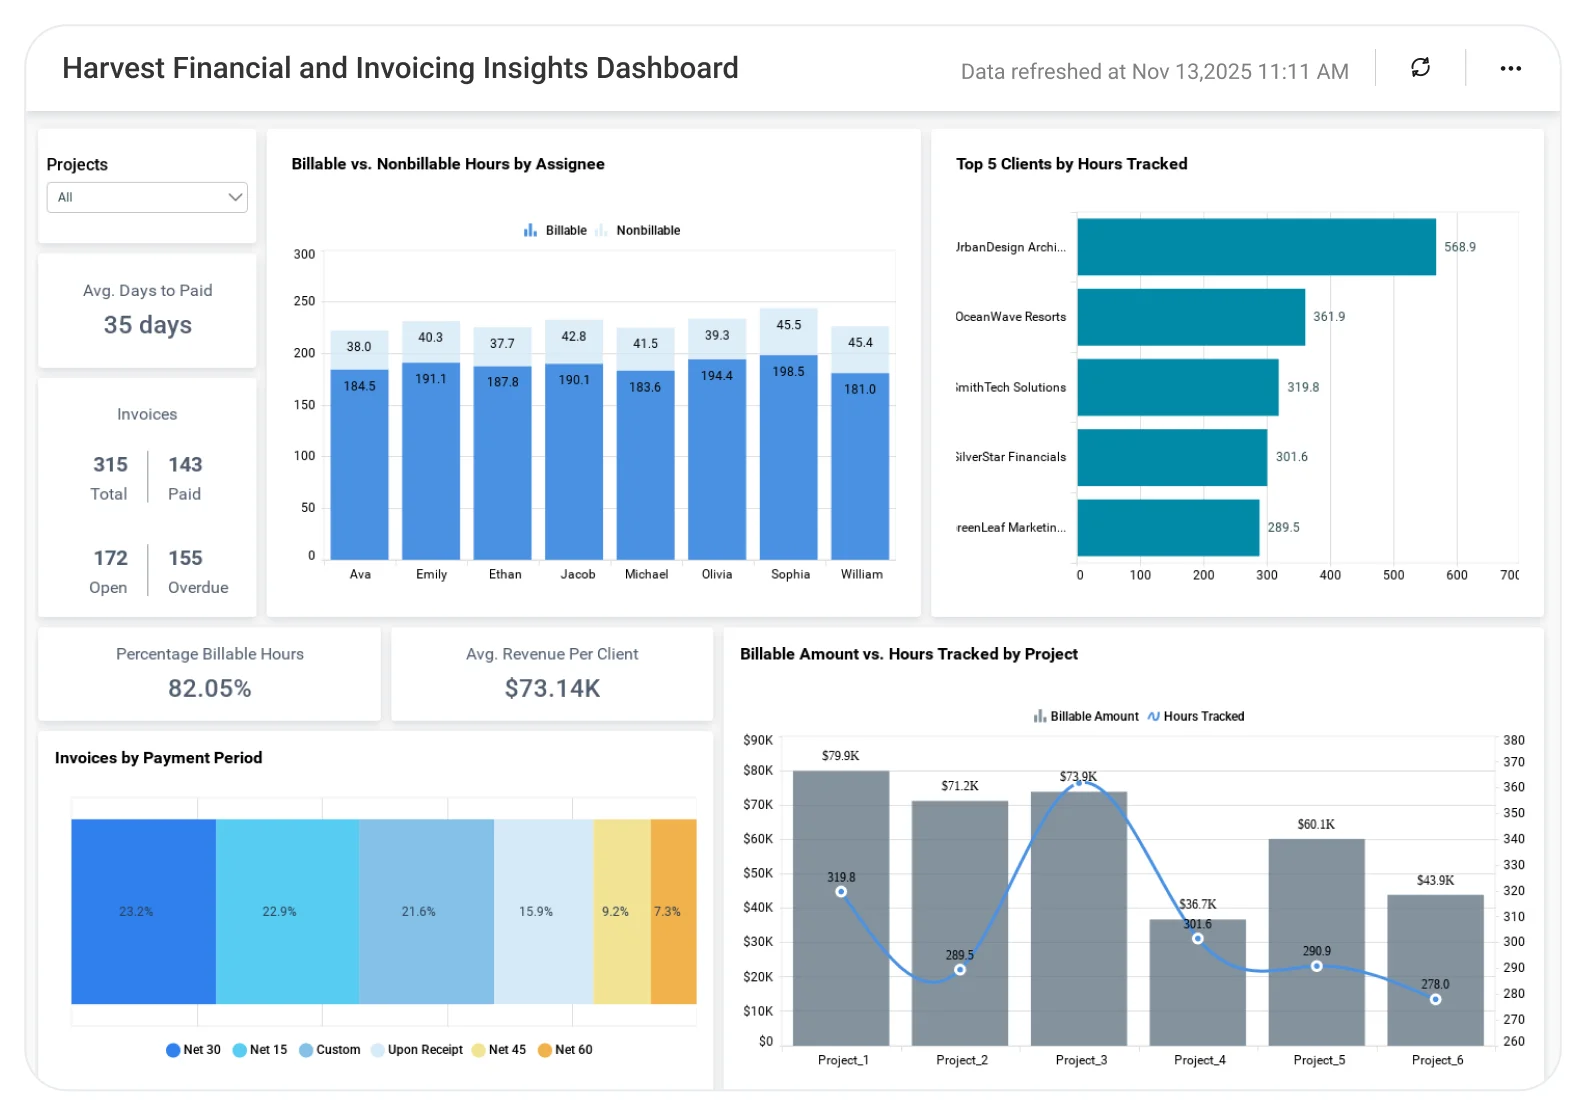
The Harvest Financial and Invoicing Insights Dashboard helps finance and operations teams track revenue performance, invoice status, billable utilization, and payment trends in one centralized view, supporting tighter financial control and faster decisions.
TL;DR
-
Gain clear visibility into revenue flow from billable work to payments received.
-
Track invoiced vs billable revenue to identify revenue leakage and missed billing early.
-
Monitor paid, overdue, and outstanding invoices to improve collections and follow-ups.
-
Analyze revenue contribution by client and project to focus on the most profitable work.
-
Improve cash flow predictability and financial decision-making with timely invoicing insights.
What Is a Harvest Financial and Invoicing Insights Dashboard?
A Harvest Financial and Invoicing Insights Dashboard is an analytics solution that transforms time‑tracking and invoicing data into clear, actionable financial insights, connecting billable work, invoices, and payments into a single decision‑ready dashboard.
With Bold BI, data from Harvest and related finance systems is unified to give CFOs, finance teams, and operations leaders a holistic view of revenue flow and billing performance.
Why Harvest Financial and Invoicing Insights Dashboard Matters
Delayed invoicing and poor visibility into payments directly impact cash flow and profitability.
When invoicing data is spread across tools:
-
Revenue leakage goes unnoticed.
-
Outstanding invoices accumulate.
-
Forecasting becomes unreliable.
-
Finance teams spend time reconciling reports.
A centralized invoicing dashboard enables organizations to move from reactive collections to proactive financial management.
What You’ll Track
Using Bold BI dashboards, you will track important KPIs such as:
-
Invoiced vs. billable revenue: Comparison of billable time and issued invoices to identify revenue gaps.
-
Invoice status & aging: Paid, pending, and overdue invoices to improve collections focus.
-
Client & project revenue contribution: Revenue breakdowns to identify high- and low-performing accounts.
-
Payment cycle metrics: Time-to-invoice and time-to-payment trends for cash flow optimization.
All dashboards are fully customizable, allowing you to add KPIs or metrics as needed.
How It Works
-
Connect Harvest and finance data sources to Bold BI.
-
Apply the Harvest Financial and Invoicing Insights Dashboard sample.
-
Combine time tracking, invoicing, and payment data into a unified model.
-
Analyze insights by client, project, team, or time period.
-
Share dashboards with finance, operations, and leadership teams.
Why Bold BI Is the Right Fit for Harvest Financial and Invoicing Insights Analytics
-
Creates a single financial view across projects and clients: Brings billable work, invoices, and payments into one consistent dashboard.
-
Improves cash flow visibility and forecasting: Helps leaders anticipate revenue timing and address payment delays early.
-
Reduces manual finance reporting effort: Replaces spreadsheet-based invoicing summaries with automated dashboards.
-
Supports executive-level financial decision-making: Delivers clear, interactive views suitable for CFOs and finance leadership.
-
Scales across growing service-based organizations: Designed for teams managing multiple clients, projects, and revenue streams.
Compare Options (at a glance)
| Feature | Bold BI | Harvest Reports | Spreadsheets |
| Unified invoicing & revenue analytics | Yes | Limited | Manual |
| Invoice aging & payment insights | Yes | Partial | Manual |
| Client & project drilldowns | Yes | Limited | Manual |
| Executive-ready dashboards | Yes | Limited | No |
| Custom KPIs & dashboards | Fully customizable | Fixed | Manual |
Frequently Asked Questions
More Articles About Harvest Financial and Invoicing Insights
-
Top 10 Finance Dashboards for Global Businesses
 Presents 10 prebuilt financial dashboard templates (e.g., balance sheet, budget vs. actual, CFO dashboard) with real-world use cases for global finance teams seeking centralized, multi-market insights.
-
Empower Finance Departments with Embedded Analytics
Demonstrates how embedded BI tools can enhance finance operations post-COVID by enabling real-time monitoring of cash flow, AR/AP turnover, liquidity ratios, risk metrics, and budget management directly inside core systems.


