
Balance Sheet Dashboard for Finance Managers
Analyze assets, liabilities, and equity to understand your company’s financial position.
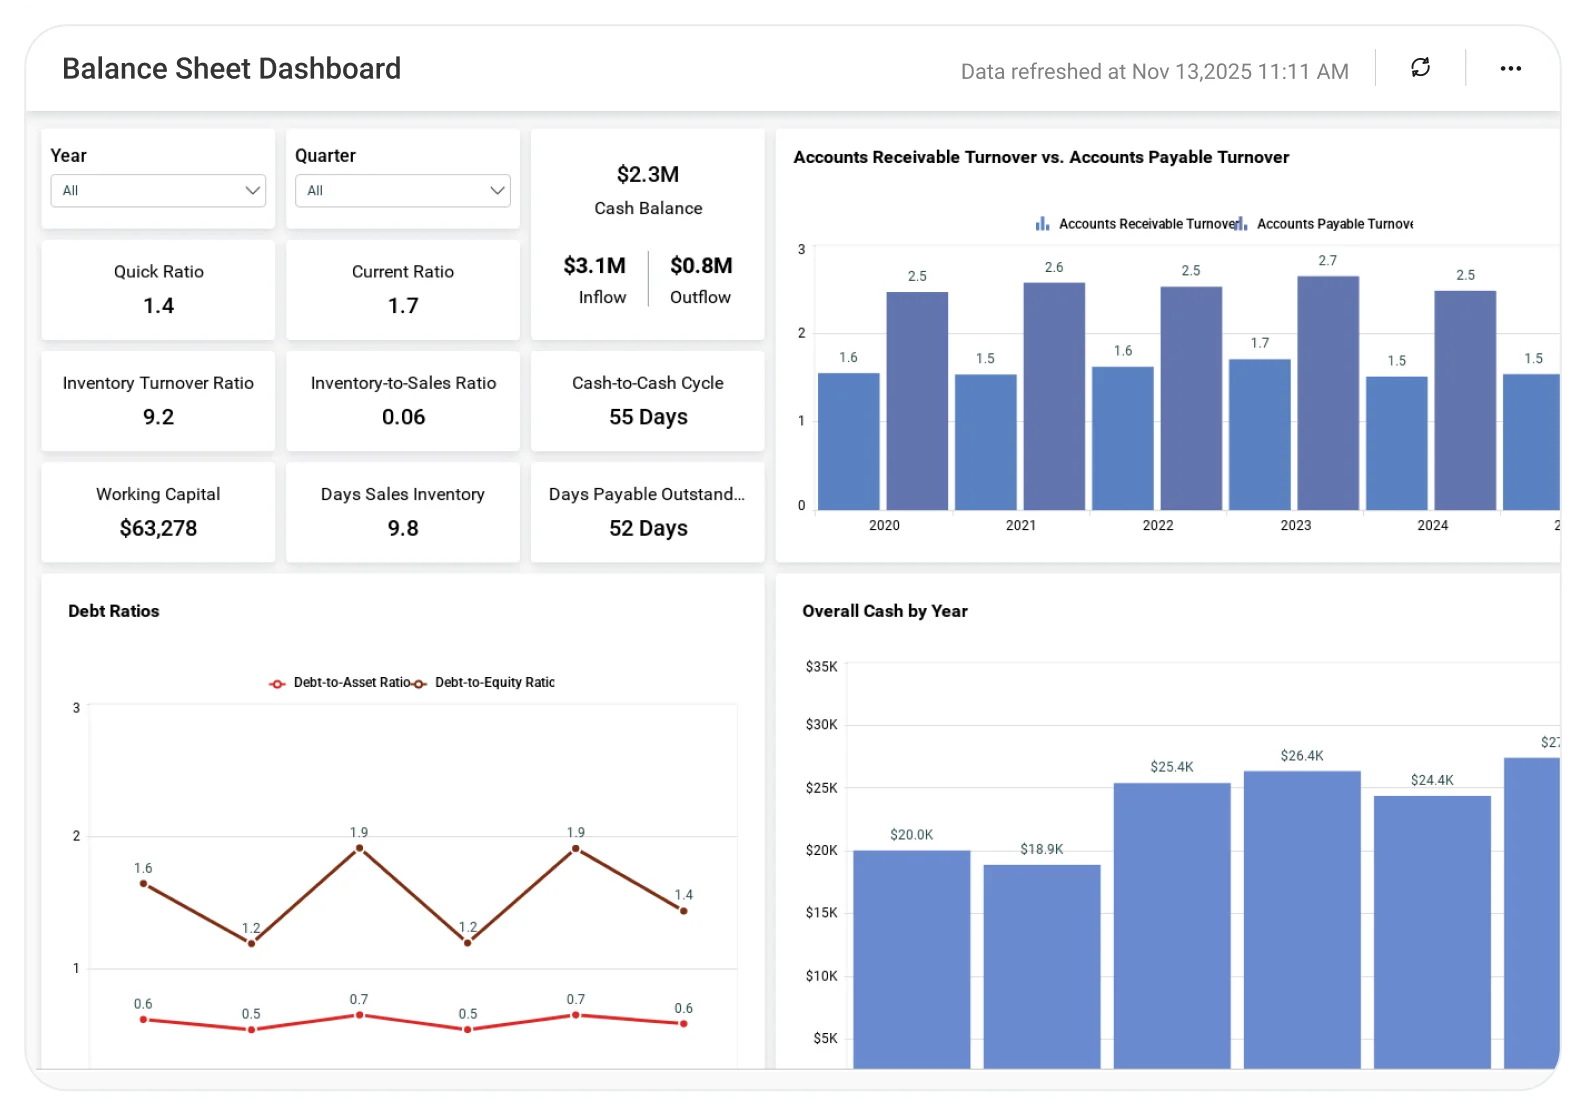
The Balance Sheet Analysis Dashboard helps finance teams evaluate financial stability, liquidity, and capital structure, enabling better risk assessment, compliance, and long-term financial planning.
TL;DR
-
Visibility: Track assets, liabilities, and equity in one view.
-
Liquidity: Monitor working capital and short-term financial health.
-
Efficiency: Analyze AR/AP turnover, DSO, and DPO metrics.
-
Inventory: Measure turnover and days inventory outstanding.
-
Reporting: View a consolidated balance sheet for executives.
What is a Balance Sheet Dashboard?
A Balance Sheet Dashboard gives a snapshot of what a business owns, what it owes, and how it manages working capital. It also highlights liquidity, leverage, AR/AP cycles, and inventory efficiency supported by detailed financial statements for deeper analysis.
Why Balance Sheet Dashboard Matters
A balance sheet shows the financial strength of a business at a given point in time but without clear visibility, it’s hard to understand liquidity, risk, and long-term stability.
A Balance Sheet Dashboard brings assets, liabilities, and equity into one real-time view, helping finance teams monitor cash position, control debt, and assess financial health quickly. With trends and comparisons made visible, leaders can spot risks early, support smarter investment decisions, and ensure the business stays financially balanced and resilient.
What You’ll Track
Using Bold BI dashboards, you will track important KPIs such as:
-
Assets, liabilities & liquidity: Working capital, current ratio, quick ratio, liquidity ratio, and key debt ratios to understand short-term stability and overall solvency.
-
Inventory performance: Inventory-to-sales ratio, turnover, DSI, and DIO to show how efficient inventory moves and how it impacts cash flow.
-
AR & AP management: AR vs. AP turnover, DSO, and DPO to monitor cash flow cycles, payment speed, and vendor management effectiveness.
-
Full financial statements: A complete balance sheet and consolidated financial view, ideal for quarterly reviews, executive reporting, and audit prep.
-
Financial trends: Analyze long-term patterns that help you understand how your numbers are shifting over time.
All dashboards are fully customizable; thus, you can add KPIs like cash conversion cycle, gross margin %, or segment-level financials as needed.
How It Works
-
Connect data from your accounting tools, Chargebee, FreshBooks, QuickBooks,or Excel/SQL databases.
-
Apply the Balance Sheet Analysis sample to view finance KPIs instantly.
-
Blend financial + operational + inventory data to understand performance drivers.
-
Securely share your dashboards across departments and CFOs.
-
Set data alerts for liquidity risks, rising DSO, or declining inventory turnover.
Why Bold BI Is the Right Fit for Balance Sheet Analytics
-
Unified financial visibility: Bring accounting, ERP, and operational data together in one dashboard for complete business context.
-
Multi-source integration: Connect ERP systems, accounting platforms, and Excel/SQL databases with live data refresh.
-
Fast, intuitive drilldowns: Move quickly from high-level KPIs to period views, account-level details, and individual line items.
-
Real-time decision support: Stay current with live accounting and ERP feeds that reflect the latest financial position.
-
Enterprise-grade security & governance: Protect sensitive financial data using Row Level Security(RLS), Single Sign-On(SSO), Role-Based Access Control(RBAC), token authentication ,and audit logs.
-
Executive-ready & embeddable: Embed dashboards into portals or executive and board reporting systems for easy access.
-
Flexible deployment: Deploy securely in cloud or self-hosted environments to meet confidentiality and compliance requirements.
Compare Options (at a glance)
| Feature | Bold BI | ERP / Accounting Reports | Spreadsheets |
|---|---|---|---|
| Balance sheet reporting by period/entity | Yes | Limited | Manual |
| Assets, liabilities & equity breakdowns | Yes | Partial | Manual |
| Drilldowns (account → sub-account → transaction) | Yes | Limited | Manual |
| Cash, receivables & payables visibility | Yes | Limited | Manual |
| Custom KPIs & dashboards | Fully customizable | Fixed | Manual |
Frequently Asked Questions
More Articles About Balance Sheet Dahboard
-
Embedded Balance Sheet Dashboard Benefits for Finance
 Explore how embedded balance sheet dashboards simplify financial tracking and improve decision-making.
-
Top 10 Finance Dashboards for Global Businesses
Discover essential finance dashboards that help global businesses monitor KPIs and optimize performance.
-
How to Create a Financial Analysis Dashboard in Bold BI
Learn step-by-step to build a financial analysis dashboard for accurate insights and better planning.


