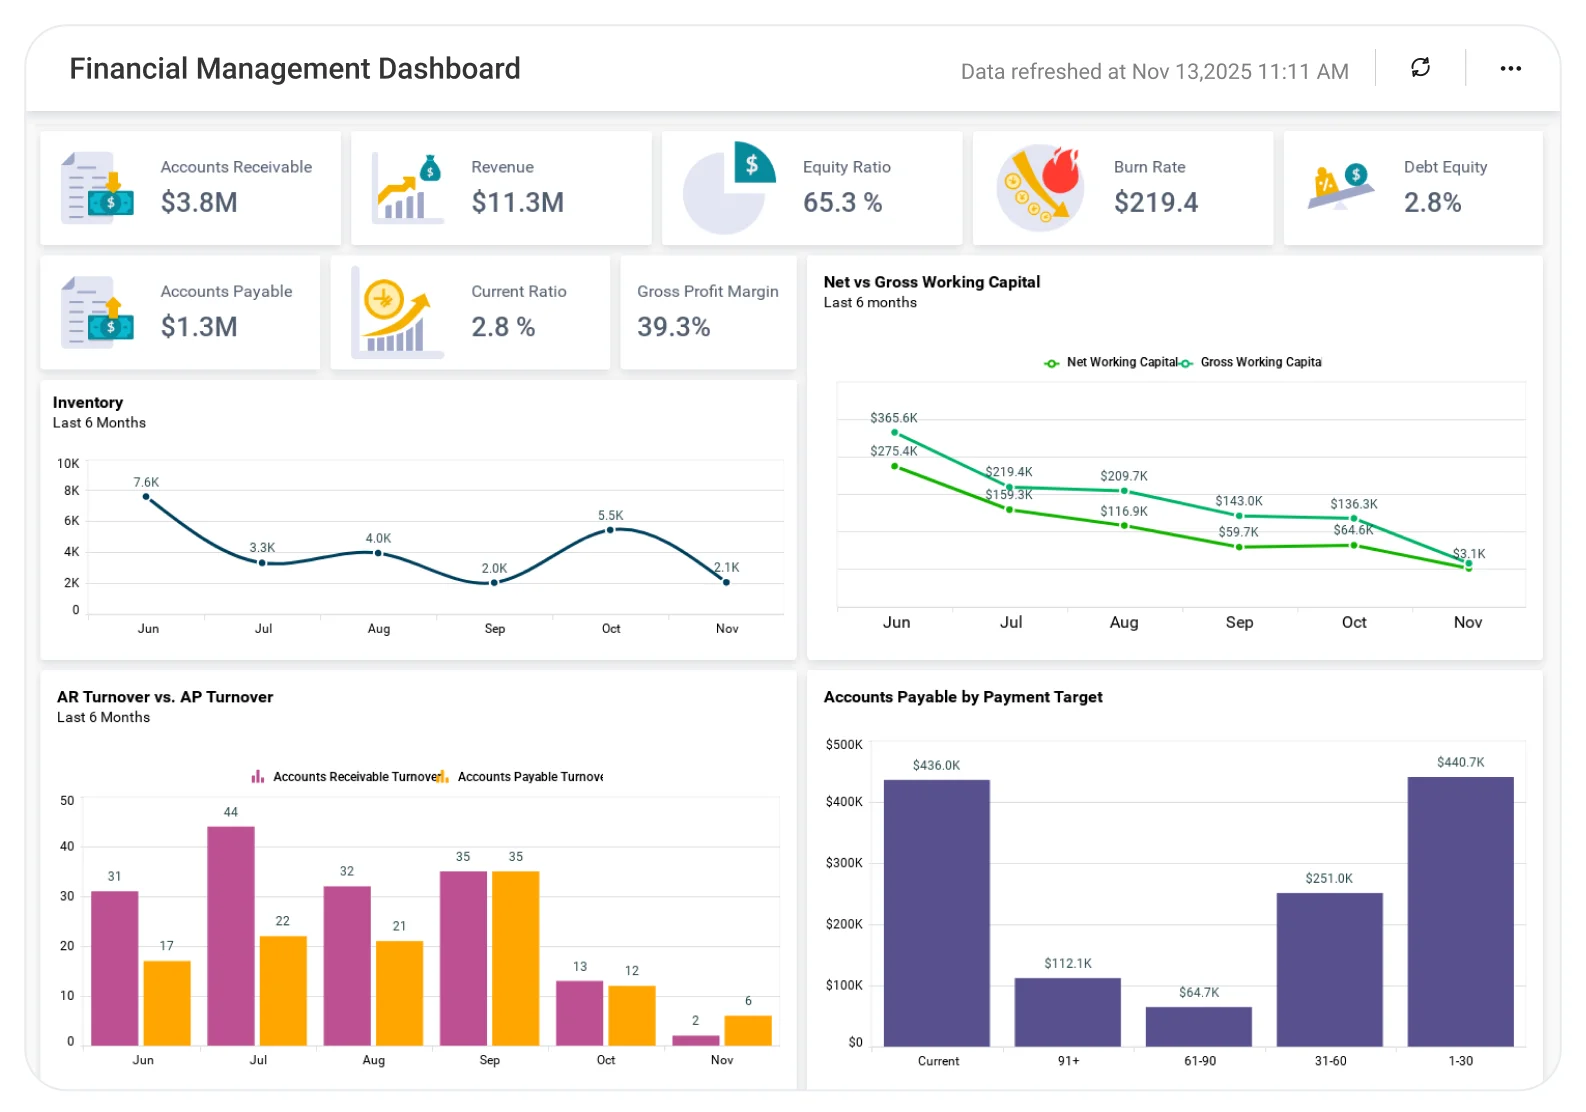
Financial Management Dashboard
Understand overall financial performance to support better planning and control.
The Financial Management Dashboard helps teams analyze income, expenses, cash flow, and financial trends, enabling improved budgeting, stronger financial control, and informed business decision-making.
TL;DR
-
Total Accounts Receivable (AR) and Accounts Payable (AP).
-
AR and AP aging by payment due date.
-
Net vs. gross working capital visibility.
-
Key balance sheet ratios (current, equity, debt-to-equity).
-
Executive-level financial health indicators.
What Is a Financial Performance Dashboard?
A Financial Performance Dashboard is a visual analytics tool that tracks liquidity, obligations, and balance sheet strength through key financial KPIs.
In Bold BI, this means interactive charts and KPIs that provide an up-to-date view of AR, AP, working capital, and financial ratios in one place.
Why Financial Performance Dashboard Matters
Financial performance isn’t just about revenue, it’s about liquidity, obligations, and long-term financial stability.
Without a centralized dashboard:
-
Cash flow risks remain hidden.
-
AR and AP imbalances grow unnoticed.
-
Balance sheet ratios are difficult to interpret quickly without clear visual context.
-
Executives lack a real-time financial snapshot.
Bold BI turns complex financial data into clear, visual insights, enabling faster decisions and stronger financial control.
What You’ll Track
-
Receivable & Payable health accounts: Track total AR and AP balances and understand how much is owed to and by the company.
-
AR & AP aging analysis: Analyze receivables and payables by due date to prioritize collections and manage vendor obligations.
-
Working capital metrics: Compare gross and net working capital to assess liquidity and operational efficiency.
-
Balance sheet ratios: Monitor current ratio, equity ratio, and debt-to-equity ratio to evaluate financial strength and risk.
All dashboards are fully customizable, so you can add KPIs or metrics as needed.
How It Works
Why Bold BI Is the Right Fit for Financial Management Analytics
Bold BI is built for executive-grade financial reporting.
With Bold BI, you can:
-
Monitor AR and AP in real time.
-
Analyze aging by payment due date.
-
Track working capital efficiency.
-
Visualize critical balance sheet ratios.
-
Deploy dashboards in cloud or self-hosted environments.
Compare options (at a glance)
| Feature | Bold BI | CRM Reports | Spreadsheets |
| AR & AP visibility | Yes | Partial | Manual |
| Aging analysis | Yes | Limited | Manual |
| Working capital tracking | Yes | No | Manual |
| Balance sheet ratios | Yes | Static | Manual |
| Deployment | Cloud / self-hosted | SaaS only | Local |
Frequently Asked Questions
More Articles About Financial Performance Dashboard
-
Top 10 Finance Dashboards for Global Businesses
Presents 10 prebuilt financial dashboard templates (e.g., balance sheet, budget vs. actual, CFO dashboard) with real-world use cases for global finance teams seeking centralized, multi-market insights.
-
Empower Finance Departments with Embedded Analytics
Demonstrates how embedded BI tools can enhance finance operations post-COVID by enabling real-time monitoring of cash flow, AR/AP turnover, liquidity ratios, risk metrics, and budget management directly inside core systems.
-
Financial Charts & Graphs for Effective Visualization
Provides insights on using charts (e.g., line, bar, pie) for visualizing financial trends, profit margins, sales performance, and expense allocations perfect for designing impactful finance dashboards.