
Profit and Loss Dashboard for Finance Managers
Understand profitability by analyzing revenues, costs, and margins across your business.
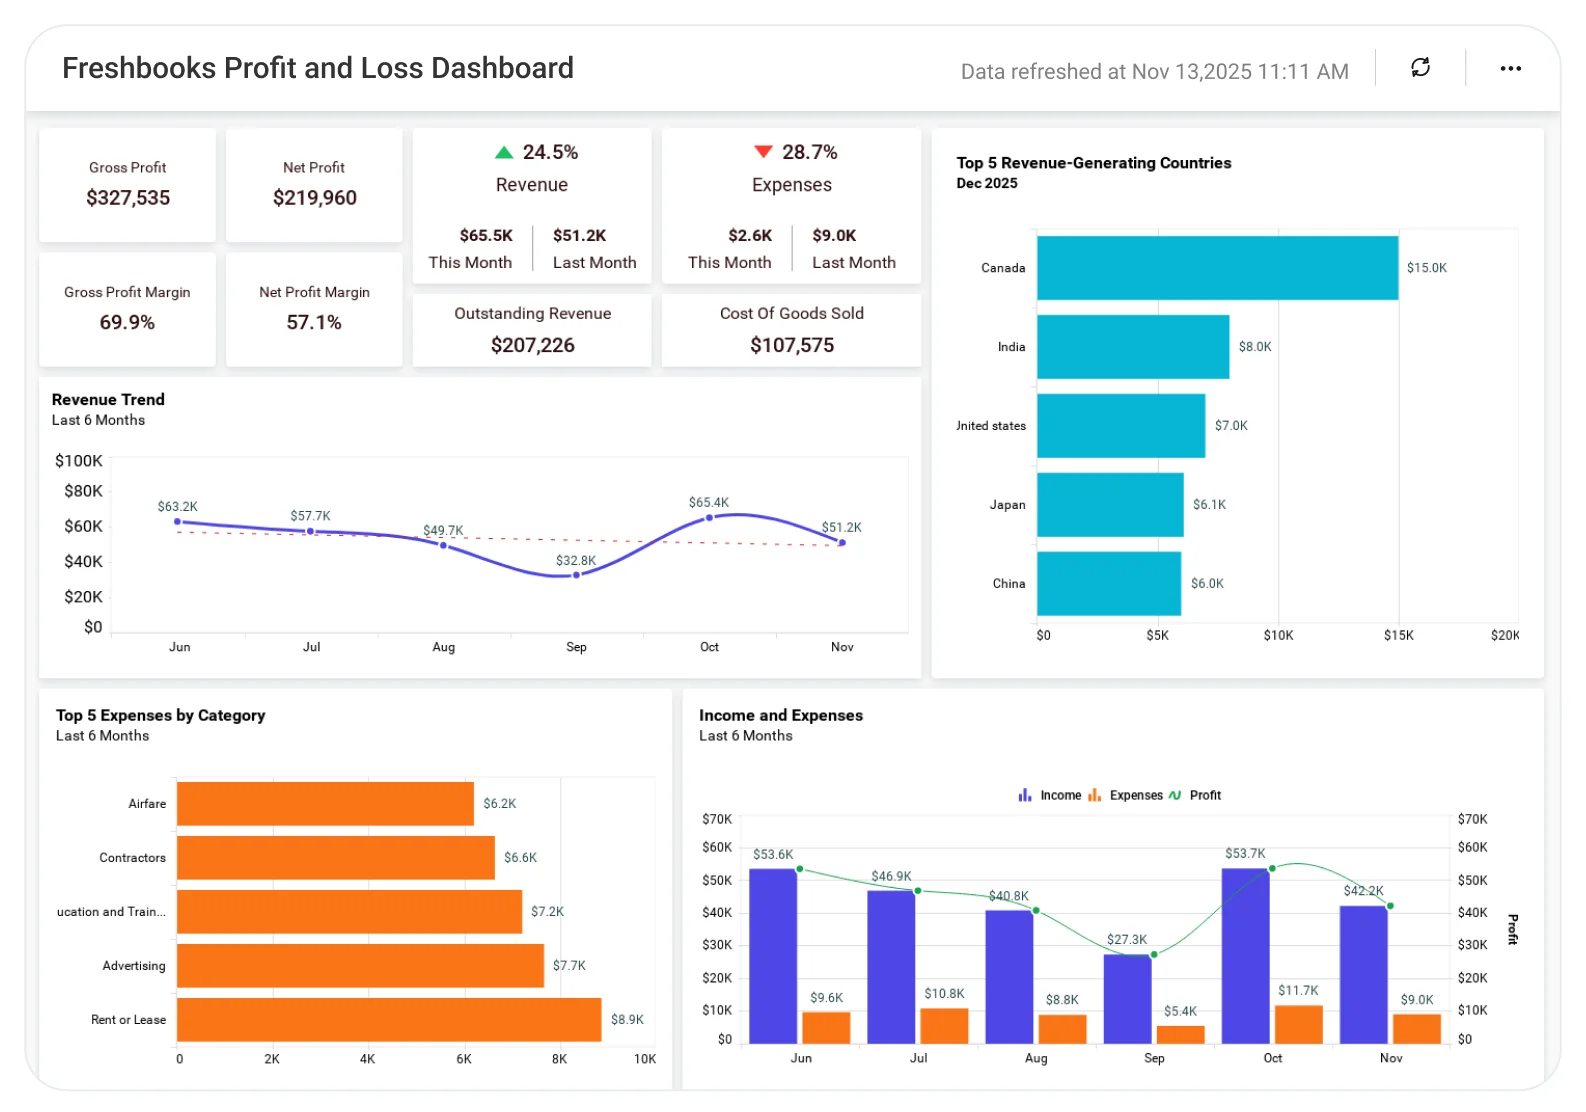
The Profit and Loss Dashboard helps finance teams evaluate income, expenses, and net profit trends, enabling better cost control, margin optimization, and informed financial decisions.
TL;DR
-
Instant margin view: Fast overview of the figures for revenue, costs, and profit margin.
-
Trend view: See how revenue, income, costs, and customer count change over time.
-
Cost breakdown: Top expense categories with monthly comparisons.
-
Customer analytics: Track expansion by region and major markets.
-
Executive summary: High-level KPIs with drill-down options for finance teams.
What Is a Profit and Loss Dashboard?
It’s a real-time, visual breakdown of revenue, expenses, and profit performance. In Bold BI, that means connected charts, KPIs, and trend lines that track financial health across months, categories, and customer segments, updated automatically from your accounting systems.
Reduce manual spreadsheet work with a live dashboard you can trust.
Why Profit and Loss Dashboard Matters
Finance data is often spread across accounting systems, CRM tools, and spreadsheets. When this data isn’t centralized, finance leaders struggle to answer critical questions such as:
-
How do revenue and expenses change each month?
-
How much is our profit margin right now, and how is it trending?
-
What are the expense categories that consume most of the resources?
-
Are customer numbers growing in key markets?
A Profit and Loss dashboard consolidates and visualizes this data in real time, helping finance teams protect margins, control costs, and plan with confidence.
What You’ll Track
-
Revenue & Expense Overview: Track total revenue, total expenses, and month-over-month changes to understand overall financial performance and trend movement.
-
Profitability Metrics: Monitor profit margin, operating income, and net income trends to evaluate how efficiently the business converts revenue into profit.
-
Expense Breakdown: Identify top cost categories, understand category-wise spending distribution, and detect unusual spikes or anomalies.
-
Customer Growth & Geographic Insights: Analyze customer acquisition trends, geographic patterns, and revenue by country to see where growth is happening.
All dashboards are fully customizable, allowing you to add KPIs like AR/AP, department budgets, cash flow indicators, or forecast models as needed.
How It Works
-
Connect your data sources such as Freshbooks, Quickbooks, Xero, Excel, SQL, Snowflake, and more.
-
Choose the sample for the Profit and Loss Dashboard.
-
Combine consumer and financial data for complete visibility
-
Share Securely share dashboards with executives or your team.
-
Create alerts for decreases in sales, expenses, or margins.
Why Bold BI Is the Right Fit for Profit and Loss Analytics
-
One platform for revenue, expense, and customer analytics.
-
Drill down from company-wide view → department → category → transaction-level detail. .
-
Secure sharing with Single Sign On, Role Based Access Control, Row Level Security and audit logs.
-
Embeddable analytics for ERP, portals, or CFO workspaces.
-
Flexible Deployment: cloud or self-hosted.
Compare options (at a glance)
| Feature | Bold BI | ERP / Accounting Reports | Spreadsheets |
|---|---|---|---|
| Profit & loss analytics by period and and entity | Yes | Limited | Manual |
| Revenue, COGS & margin tracking | Yes | Partial | Manual |
| Department, product & region drilldowns | Yes | Limited | Manual |
| Budget vs. actuals & variance visibility | Yes | Limited | Manual |
| Custom KPIs & dashboards | Fully customizable | Fixed | Manual |
Frequently Asked Questions
More Articles About Profit and Loss Dashboard
-
10 Financial Dashboard Examples for Global Businesses
 Highlights how to track revenue, expenses, profit margin, and customer growth over time.
-
How to Create a Profit and Loss Dashboard
This video will guide you through adding and configuring widgets on a profit and loss dashboard in Bold BI.


