
Toggl Project Time Tracking Dashboard for Project Managers
Understand how time is spent across projects to improve productivity and planning.
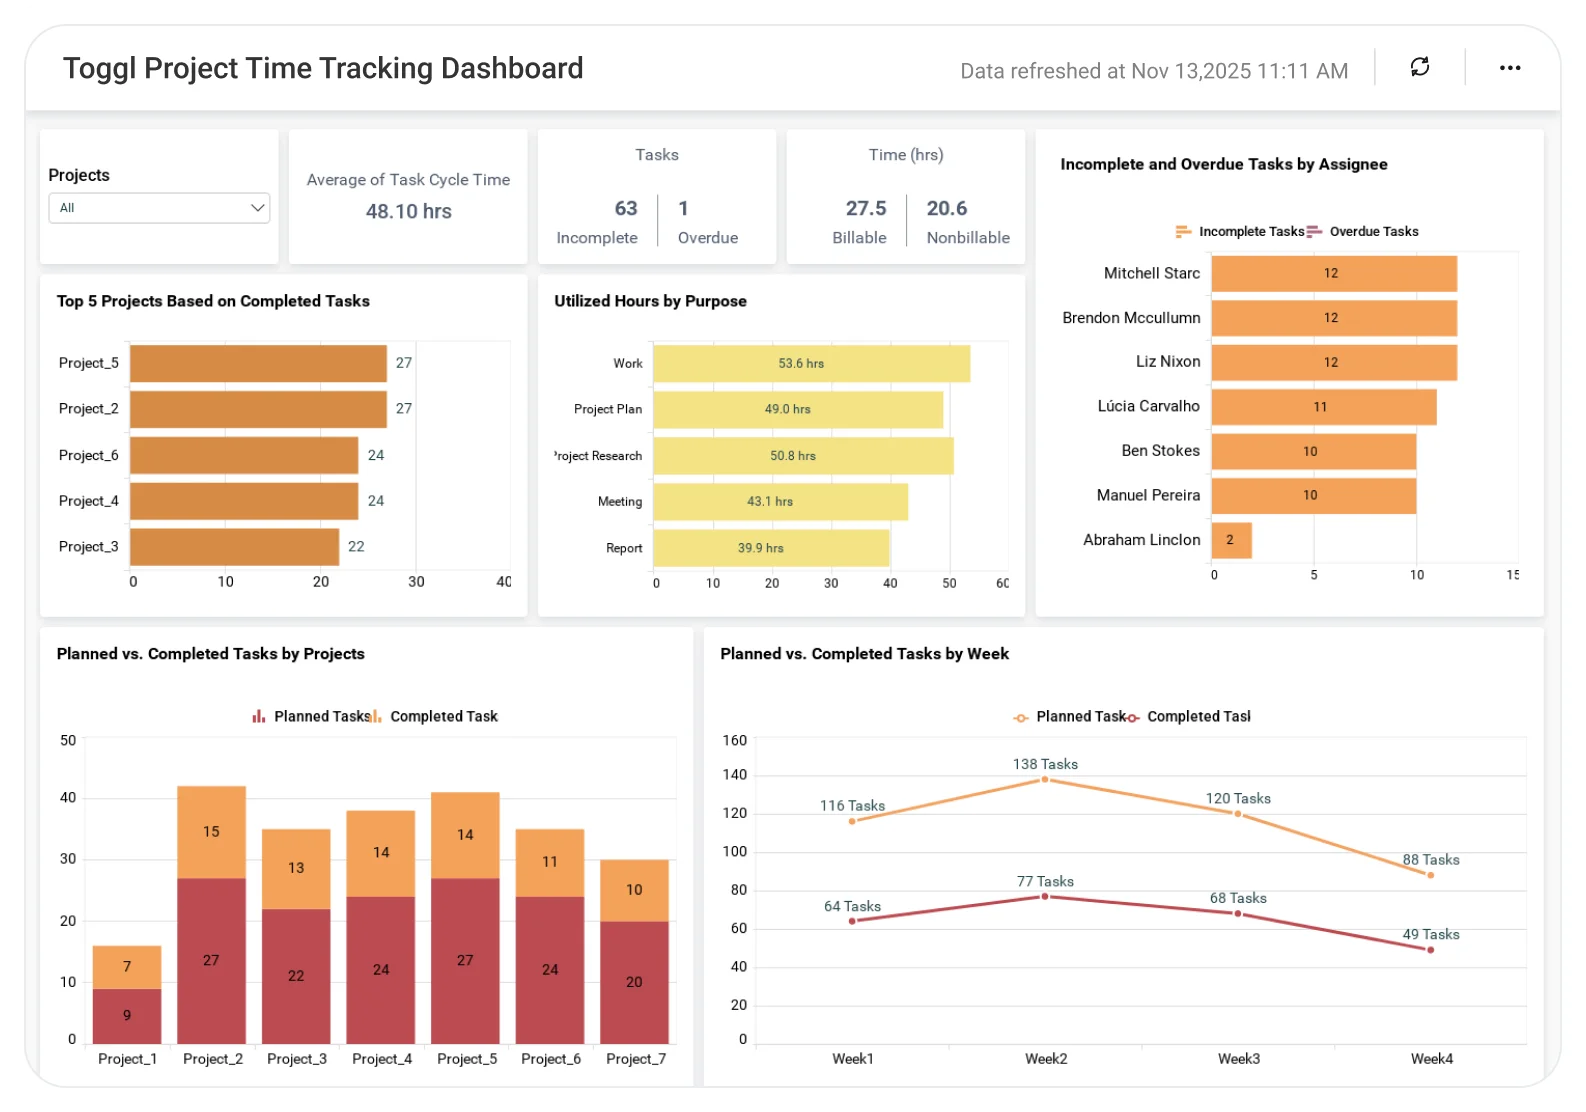
The Toggl Project Time Tracking Dashboard helps teams analyze logged hours, project-wise effort, and time usage patterns, enabling better workload planning, accurate reporting, and improved project efficiency.
TL;DR
-
Real-time billable versus non-billable hours across projects and teams.
-
Resource utilization insights to identify under- or over-allocation.
-
Project budget vs. actual time tracking and profitability metrics.
-
Executive summary of time distribution by client, project, or task.
-
Alerts for time overruns, scope creep, and missed billable targets.
What Is Toggl Project Time Tracking Dashboard?
The dashboard provides managers with a live, insightful view of how teams allocate their time across projects and clients.
In Bold BI, it means unified charts and visuals showing logged hours, billable ratios, and cost trends helping you connect team effort with business outcomes.
Why Toggl Project Time Tracking Dashboard Matters
When time data is scattered across tools, it’s hard to see where effort truly goes.
Bold BI brings your Toggl data to life helping you answer:
-
What is the total number of completed versus incomplete tasks?
-
How is the project time being distributed by our specified tags?
-
Who has the most incomplete and overdue tasks?
-
What is the top 5 most successful projects based on performance?
-
Where are we overspending time?
What You’ll Track
-
Time distribution: Track hours logged by project, client, or task type.
-
Billable vs. non-billable: Monitor total productive hours vs. internal or admin work.
-
Utilization rates: Understand individual and team-level time allocation.
-
Team performance: See top contributors, overtime, and idle time patterns.
All samples are customizable so you can add your own KPIs, link with finance or CRM data, and create your ideal time-performance view.
How It Works
-
Choose the Toggl Project Time Tracking sample.
-
Blend time, delivery, and finance data to answer, “Where is our time driving value?”.
-
Share dashboards – role-based views for PMs, finance, and executives.
-
Set alerts for risk indicators like time overages or underutilization.
Why Bold BI is the Right Fit for IT Teams
-
Bold BI is an analytics platform that combines time-tracking, delivery, and finance KPIs in one view.
-
It offers self-service and governed analytics for PMs, leads, and executives.
-
Flexibility in deployment (cloud or self-hosted) with secure embedding in portals or apps.
Compare Options (at a glance)
| Feature | Bold BI | Toggl Built-in Reports | Spreadsheets / Manual Reporting |
|---|---|---|---|
| Project time summary (hours by project/client) | Yes | Yes (basic) | Manual |
| Billable vs non-billable analysis | Yes | Limited | Manual |
| Team utilization & capacity tracking | Yes | Limited | Manual |
| Time trends & forecasting (weekly/monthly) | Yes | Limited | Manual |
| Custom KPIs & dashboards | Fully customizable | Fixed | Manual |
Frequently Asked Questions
More articles About Toggle Project Time Tracking Dashboard
-
Visualizing and Managing Projects with Bar Charts
 Covers benefits like improved visibility, accurate forecasting, and better decision-making. Offers tips for defining KPIs, segmenting leads, and integrating with other tools.
-
Understanding Data Insights: Tips to Make Better Decisions
Discover practical tips to interpret data insights and make smarter project decisions quickly.


