
Customer Service Performance Dashboard
Improve IT Service Quality with Real-Time Support Performance Insights.
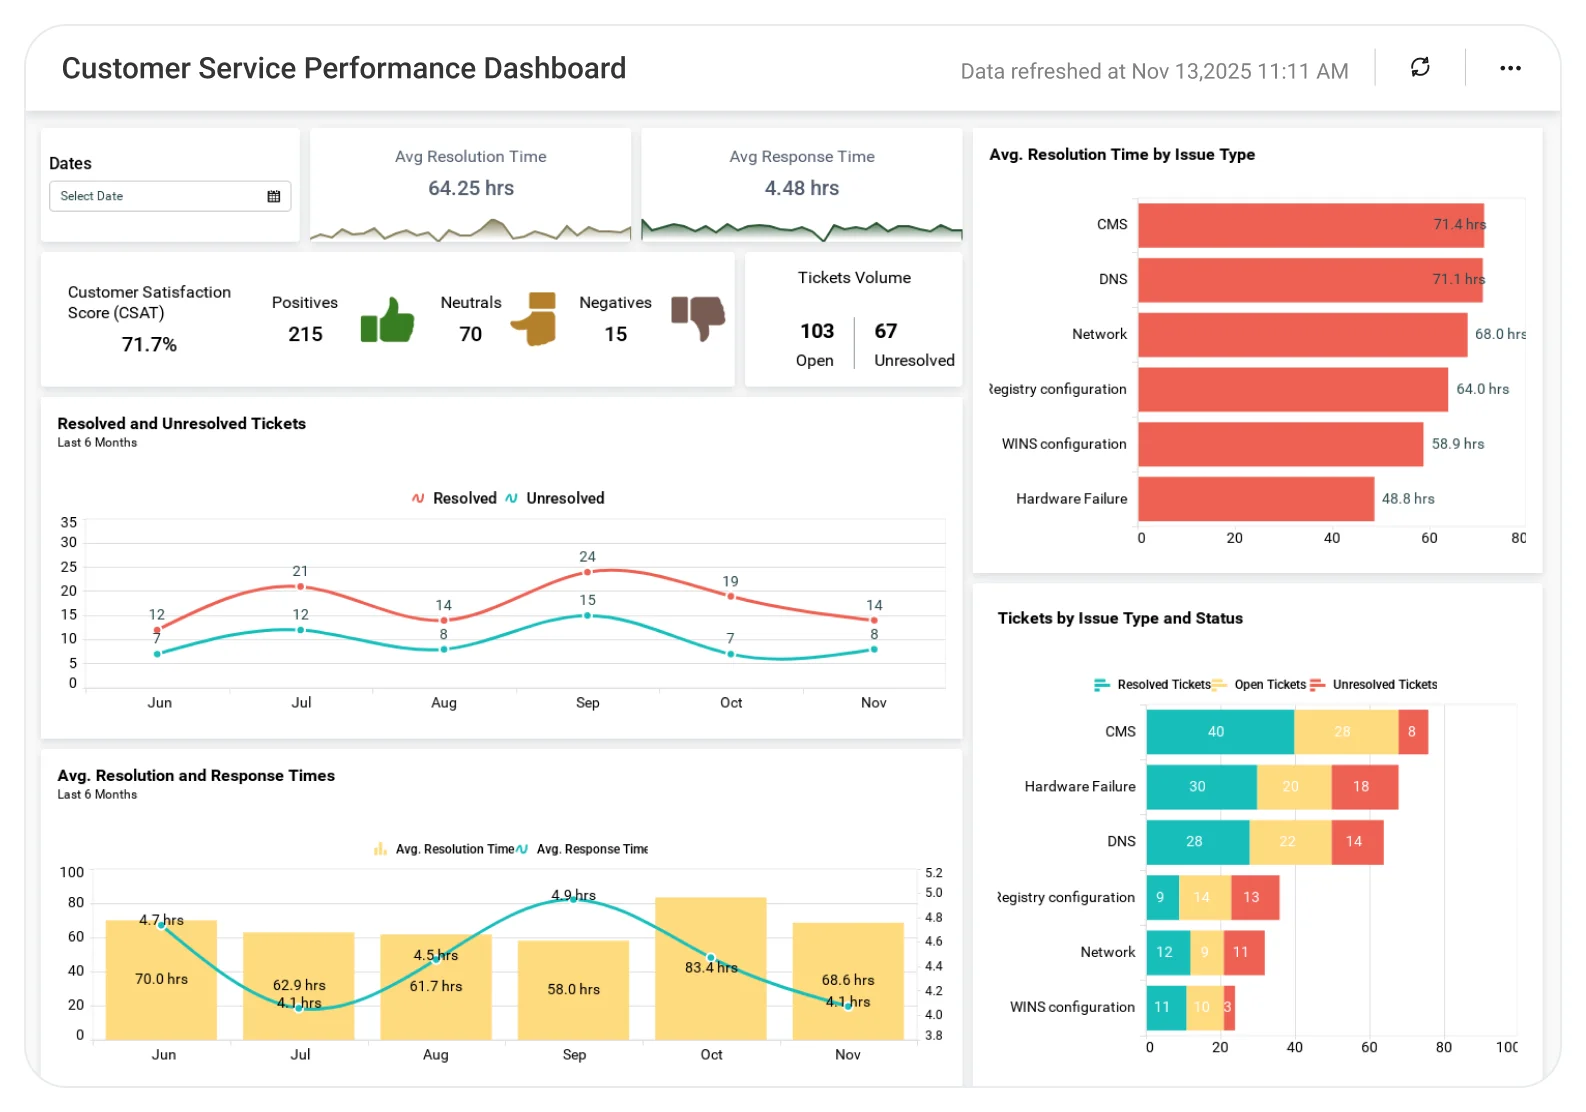
The Customer Service Performance Dashboard in Bold BI gives IT operations and support leaders a real-time view of ticket volume, resolution times, issue types, and system downtime so teams can improve response efficiency and service quality.
TL;DR
-
Total support tickets received and resolved.
-
Average ticket resolution time.
-
Ticket breakdown by issue type and status.
-
Monthly system downtime trends.
-
Time-based service performance comparisons.
What Is a Customer Service Performance Dashboard?
A Customer Service Performance Dashboard visualizes support ticket activity, resolution efficiency, and system uptime.
In Bold BI, this means interactive KPIs, charts, and filters that help teams understand daily service performance and long-term trends.
Why Customer Service Performance Dashboard Matters
Customer service teams handle thousands of interactions daily. Even minor inefficiencies can lead to frustrated customers, negative reviews, and lost revenue.
Without centralized visibility:
-
Response delays go unnoticed until complaints spike.
-
Service quality issues are hard to pinpoint across channels.
-
Key metrics like CSAT, resolution time, and ticket backlog are scattered across tools.
-
Decisions become reactive instead of proactive.
A Customer Service Performance Dashboard brings all critical KPIs like response time, resolution rates, customer satisfaction scores into one place. This empowers support teams to spot issues early, improve workflows, and deliver exceptional customer experiences
What You’ll Track
Using Bold BI dashboards, you will track important project overview KPIs such as:
-
Ticket Volume & Resolution Status: Track total tickets received, resolved, and unresolved to understand service workload and backlog.
-
Resolution Efficiency: Monitor average ticket resolution time across periods to identify delays and improve response speed.
-
Issue Type Performance: Break down tickets by issue category to focus resources on high-impact problem areas.
-
System Downtime Trends: Analyze monthly downtime to assess system reliability and operational risk.
-
Service Performance Over Time: Compare ticket volume, resolution speed, and downtime across time periods to measure improvements.
All dashboards are fully customizable so you can add KPIs, apply filters, and drill down by issue type, status, or date range for real-time service performance insights.
How It Works
Why Bold BI Is the Right Fit for Customer Service Performance Analytics
Bold BI is designed to handle high-volume support and IT operations data without performance or visibility gaps.
With Bold BI, you can:
-
Monitor support ticket volume and resolution rates.
-
Track average resolution time across periods.
-
Analyze ticket statistics by issue type.
-
Measure system downtime and reliability.
-
Deploy dashboards in cloud or self-hosted environments.
Compare Options (at a glance)
| Feature | Bold BI | Service Desk Reports | Spreadsheets |
| Ticket resolution tracking | Yes | Partial | Manual |
| Issue-type analysis | Yes | Limited | Manual |
| Downtime monitoring | Yes | Partial | Manual |
| Trend analysis | Yes | Limited | Manual |
| Deployment | Cloud / self-hosted | SaaS only | Local |
Frequently Asked Questions
More Articles About Customer Service Performance Dashboard
-
Maximizing ROI with Effective Customer Analytics
 Explains how customer analytics drives smarter decisions, helping improve service quality and boost ROI.
-
Customer-Facing Analytics: What It Is, Benefits & Use Cases
Discusses how customer-facing analytics enhances transparency and trust, improving overall satisfaction.
-
Mastering Customer Retention through BI Analytics
Shows how BI analytics identifies churn risks and retention drivers, helping teams keep customers engaged.


