
Snowflake Usage Overview Dashboard
Understand data warehouse usage and performance to support better analytics and decision-making.
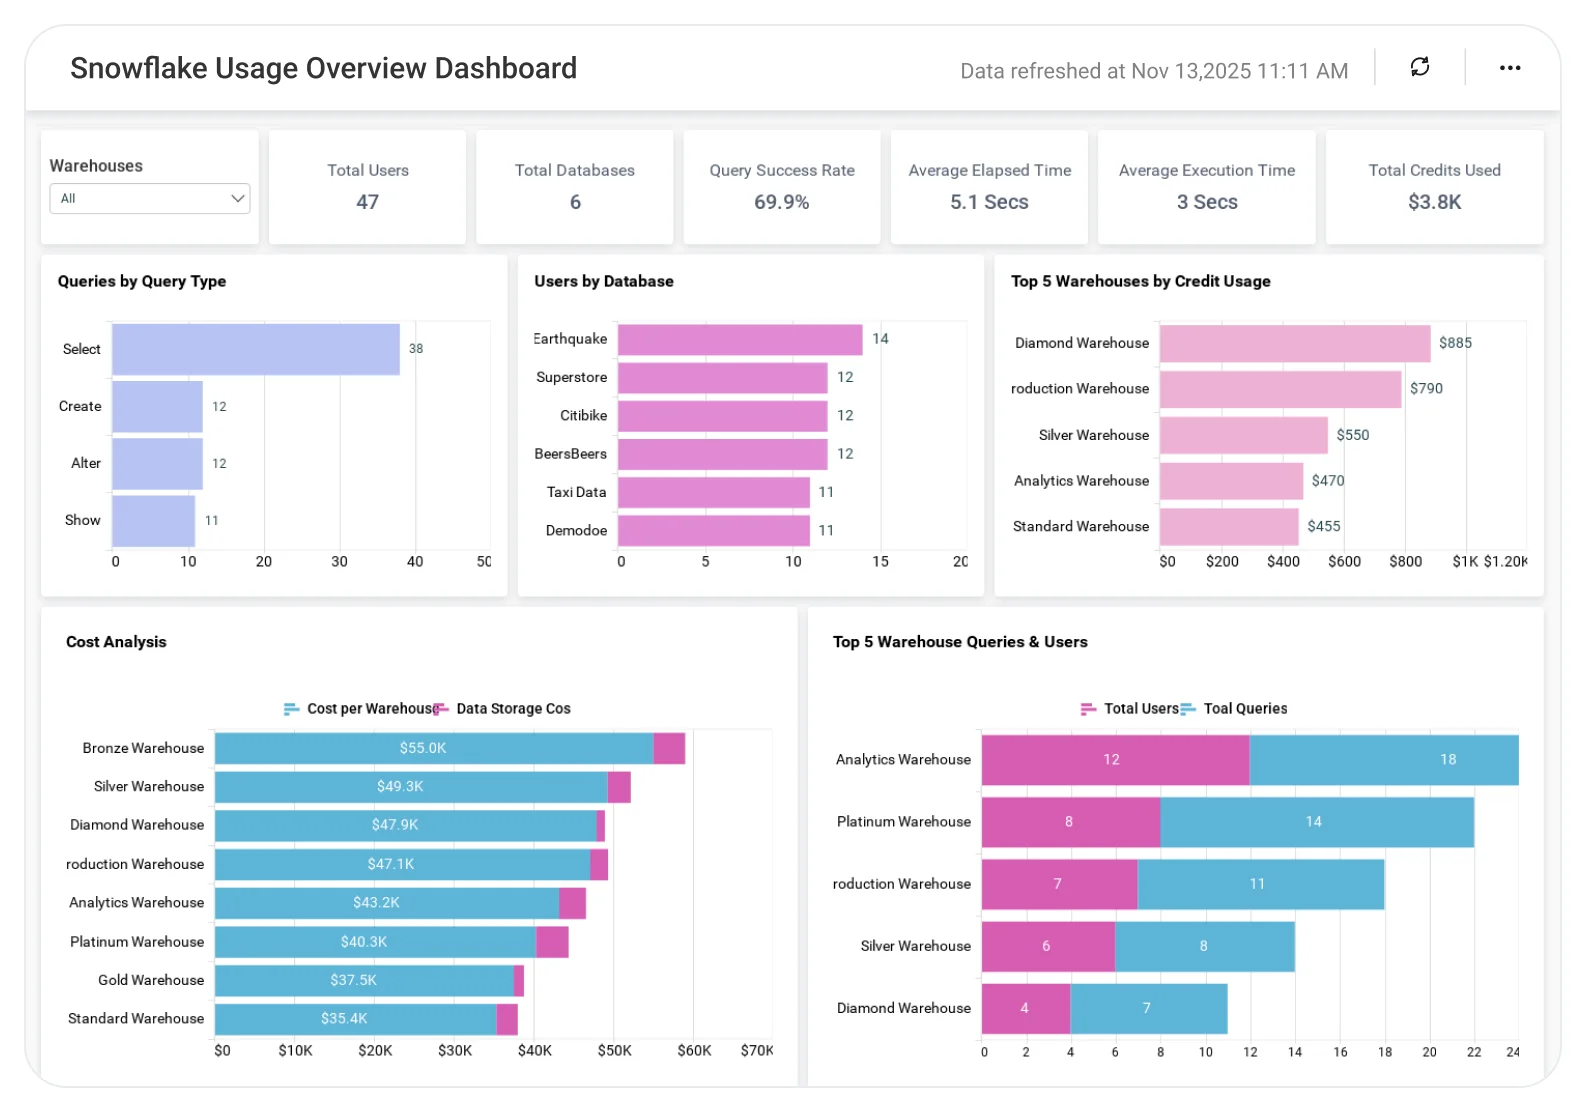
The Snowflake Dashboard helps teams analyze query performance, resource usage, data consumption, and cost trends, enabling optimized workloads, controlled spending, and more efficient data operations.
TL;DR
-
Total queries submitted and query success rate.
-
Snowflake credits consumed and used by warehouses.
-
Users by database and query activity.
-
Query performance metrics (elapsed time, compilation time).
-
Top users ranked by query success.
What Is a Snowflake Usage Overview Dashboard?
A Snowflake Usage Overview Dashboard visualizes query activity, performance, user behavior, and credit consumption in Snowflake.
In Bold BI, this means interactive KPIs, charts, and tables that help IT teams optimize Snowflake performance while keeping costs under control.
Why Snowflake Usage Overview Dashboard Matters
Snowflake environments grow fast and costs can grow even faster.
Without clear visibility:
-
Credit usage spikes go unnoticed.
-
Inefficient queries slow performance.
-
Resource-heavy users are hard to identify.
-
Capacity planning becomes more reactive.
Bold BI delivers one centralized Snowflake usage view, helping teams manage performance, cost, and adoption proactively.
What You’ll Track
The Snowflake dashboard provides a holistic approach toward data management by incorporating valuable insights into queries by type, user queries, warehouse, and database users.
-
Query activity & performance: Track total queries, query success rates, elapsed time, and compilation time.
-
Credit usage & cost control: Monitor total credits consumed and credit usage by warehouse.
-
User & database behavior: Analyze users by database, user queries, and top users by query success.
-
Warehouse utilization: Understand how warehouses are being used to optimize performance and spend.
All dashboards are fully customizable so you can add KPIs or metrics as needed.
How It Works
-
Connect Snowflake system usage and account usage data.
-
Apply the Snowflake Usage Overview Dashboard sample.
-
Analyze usage, performance, and costs in real time.
-
Drill down into warehouses, users, and databases.
-
Share dashboards with IT, data, and finance teams.
Why Bold BI Is the Right Fit for Snowflake Usage Overview Analytics
Bold BI is built for modern cloud data platforms like Snowflake, with a focus on usage visibility, cost control, and performance monitoring.
With Bold BI, you can:
-
Track Snowflake usage and query activity in real time.
-
Monitor credit consumption by warehouse.
-
Analyze query performance and success rates.
-
Understand user behavior across databases.
-
Deploy dashboards in cloud or self-hosted environments.
Compare Options (at a glance)
| Feature | Bold BI | Snowflake UI | Spreadsheets |
| Usage & query analytics | Yes | Partial | Manual |
| Credit usage tracking | Yes | Limited | Manual |
| User behavior analysis | Yes | Limited | Manual |
| Performance trend analysis | Yes | Limited | Manual |
| Deployment | Cloud / self-hosted | SaaS only | Local |
Frequently Asked Questions
More Articles About Snowflake Usage Overview Dashboard
-
Top 5 Dashboarding Tools to Explore for Snowflake in 2025:
 This blog highlights the best dashboard tools for Snowflake, helping teams visualize usage, optimize performance, and control costs.


