
HR Training Feedback Dashboard
Evaluate training feedback to improve learning quality and program effectiveness.
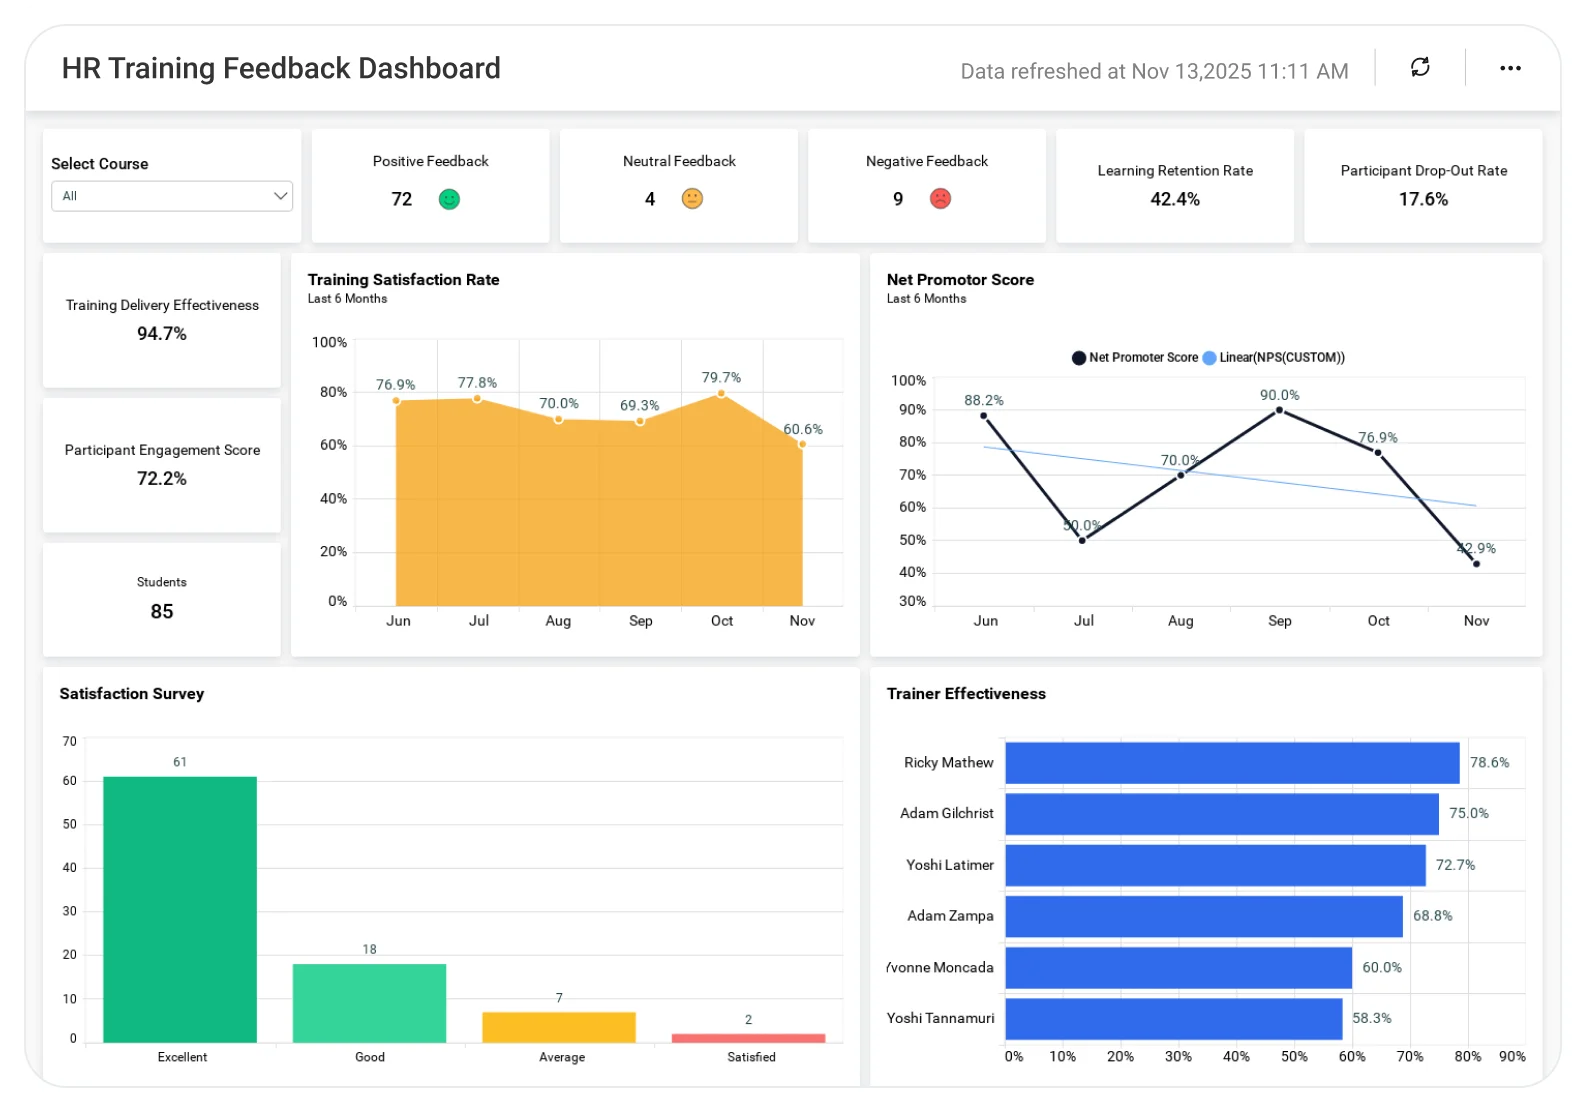
The Training Feedback Dashboard helps HR and L&D teams analyze participant feedback, satisfaction scores, and improvement areas, enabling continuous enhancement of training programs and better learning outcomes.
TL;DR
-
Overall training satisfaction rates.
-
Net Promoter Score (NPS) and dropout rate gauges.
-
Highest- and lowest-engagement trainees based on engagement scores.
-
Total courses offered and registered trainees.
-
Top five successful training courses.
-
Monthly trends for satisfaction, responses, and NPS.
A single, executive-ready view of training effectiveness.
What Is an HR Training Feedback Dashboard?
An HR Training Feedback Dashboard is a visual analytics tool that tracks employee training satisfaction, engagement, dropout rates, and NPS trends.
In Bold BI, it becomes an interactive, customizable dashboard that helps HR and L&D teams measure and improve training effectiveness.
Why Training Feedback Analysis Matters
Training success isn’t just about course completion; it’s about how learners experience and value the training.
Without a centralized view of feedback, HR teams struggle to answer key questions like:
-
Are employees satisfied with our training programs?
-
Which trainees are highly engaged and which are disengaging?
-
Which courses deliver the strongest outcomes?
-
Are satisfaction and NPS improving over time?
The HR Training Feedback Dashboard answers these questions helping HR leaders improve training quality with confidence.
What You’ll Track
-
Training Satisfaction & NPS: Measure overall learner satisfaction and Net Promoter Score (NPS) to understand how employees perceive and recommend your training programs.
-
Engagement & Dropout Rates: Track trainee engagement levels and dropout rates to quickly identify disengagement risks and participation gaps.
-
Top & Low Performing Trainees and Courses: Compare top-performing and lowest-rated trainees, along with the most successful courses, to drive targeted coaching and course improvements.
-
Detailed Trainee Feedback & Performance: View trainee-level feedback, ratings, training status, and performance. Drill down by trainee or course to compare satisfaction and engagement.
-
Training Feedback Trends Over Time: Analyze monthly trends for satisfaction, responses, and NPS to validate improvements, spot early warning signs, and refine training strategies.
All dashboards are fully customizable so you can add KPIs or metrics as needed.
How It Works
Why Bold BI Is the Right Fit for HR Training Feedback Analytics
-
Unified view of training satisfaction, engagement, and NPS.
-
Interactive charts with filters and drilldowns.
-
Executive-ready KPIs and visualizations.
-
Enterprise-grade security with Single Sign On, Role Based Access Control and Row Level Security.
-
Embeddable dashboards for HR and learning portals.
-
Cloud or self-hosted deployment options.
Compare Options (at a glance)
| Feature | Bold BI HR Training Feedback Dashboard | HR / LMS Feedback Reports | Spreadsheets |
| Training feedback analysis | Yes | Limited | Manual |
| Trainer & session-wise ratings | Yes | Limited | Manual |
| Trend analysis over time | Yes | Limited | Manual |
| Interactive filtering & drilldowns | Yes | No | No |
| Shareable, management-ready insights | Yes | Limited | No |
Frequently Asked Questions
More Articles About HR Training Feedback
-
Ease Your Workforce Management with Embedded Analytics
 Discusses how survey data, ratings, and employee feedback can be embedded into dashboards useful background for understanding how training feedback surveys power HR dashboards.


