
Resignation Details Dashboard for HR Managers
Understand employee resignation trends to improve retention and workforce stability.
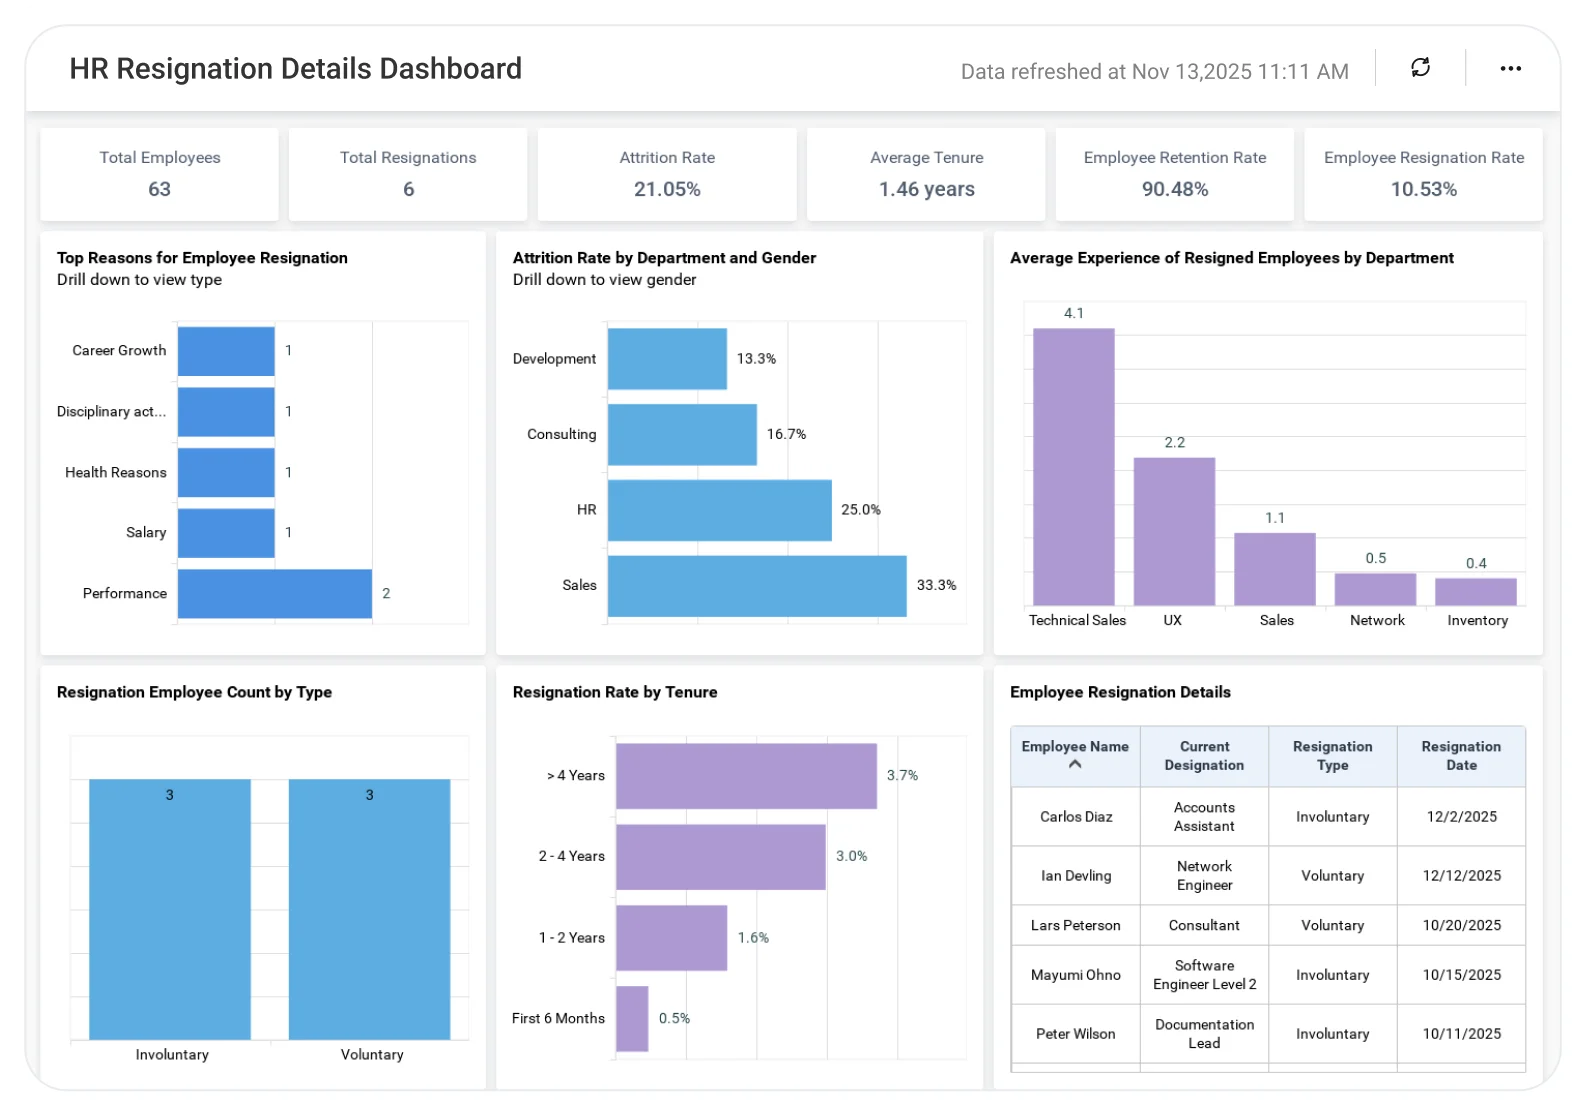
The Resignation Details Dashboard helps HR teams analyze resignation reasons, turnover patterns, and department-wise exits, enabling proactive retention strategies and better workforce planning.
TL;DR
-
Real-time attrition monitoring: Track resignations by exit type and time period.
-
Root-cause visibility: Identify departments, roles, or managers with high turnover.
-
Retention risk indicators: Spot early warning signs using engagement and tenure metrics.
-
Exit insights: Understand why employees leave for instance due to pay, culture, workload, or growth.
-
Executive-ready summaries: View workforce stability by department, gender, or tenure band.
What Is a Resignation Details Dashboard?
A Resignation Details Dashboard helps HR leaders track employee turnover and understand what’s driving it.
With Bold BI, you can explore interactive charts, apply filters, and drill down into resignation data so you can act before issues escalate.
Why Resignation Details Dashboard Matters
Employee resignations directly impact productivity, hiring costs, and team stability. Without clear visibility into turnover patterns, tenure, and exit reasons, HR leaders are forced to react after problems escalate.
Resignation analytics helps HR teams identify retention risks early, understand why employees leave, and take proactive steps to improve workforce stability and long-term organizational health.
What You'll Track
-
Turnover rate: Compare resignations to total headcount.
-
Resignation trends: Analyze exits by month, department, location, or role.
-
Tenure insights: See how long employees stay before leaving.
-
Exit reasons: Understand voluntary vs. involuntary departures.
-
Manager and department impact: Identify patterns early and intervene sooner.
How It Works
-
Connect: CSV, Excel or Web API data sources.
-
Apply sample: Utilize the ready-made Resignation Details Dashboard for immediate analysis.
-
Combine the data: Bring everything together by linking attrition rates with engagement, salary, and performance. This gives you a clearer picture of what’s really driving turnover.
-
Share securely: Control access by role, department, or leadership level.
Why Bold BI Is the Right Fit for Resignation Details Analytics
-
Unified workforce insights: Combine HR, payroll, engagement, and workforce data in one interactive dashboard.
-
Deep drilldowns: Move from company-wide resignation trends down to individual employee records securely.
-
Self-service with governance: Enable HR leaders to explore data independently while maintaining access control with Single Sign On, Role Based Access Control, and Row Level Security.
-
Embedded analytics: Embed resignation dashboards directly into HR systems or employee portals.
-
Flexible deployment: Deploy securely in the cloud or self-hosted environments based on compliance needs.
Compare Options (at a glance)
| Feature | Bold BI | HRIS / Exit Reports | Spreadsheets |
|---|---|---|---|
| Resignation trends over time | Yes | Limited | Manual |
| Reason analysis (exit interview categories) | Yes | Partial | Manual |
| Breakdowns by by dept/role/location/manager | Yes | Limited | Manual |
| Tenure bands & new-hire attrition visibility | Yes | Limited | Manual |
| Custom KPIs & dashboards | Fully customizable | Fixed | Manual |
Frequently Asked Questions
More Articles About Resignation Details
-
Mastering Employee Turnover Analysis
 This blog post discusses how data visualization helps HR teams analyze and reduce employee turnover. It covers various widgets and metrics for an employee turnover dashboard, including voluntary vs. involuntary turnover rates, common resignation reasons, and cost of turnover.


