
HR Training Dashboard
Understand employee training outcomes to improve skill development and learning effectiveness.
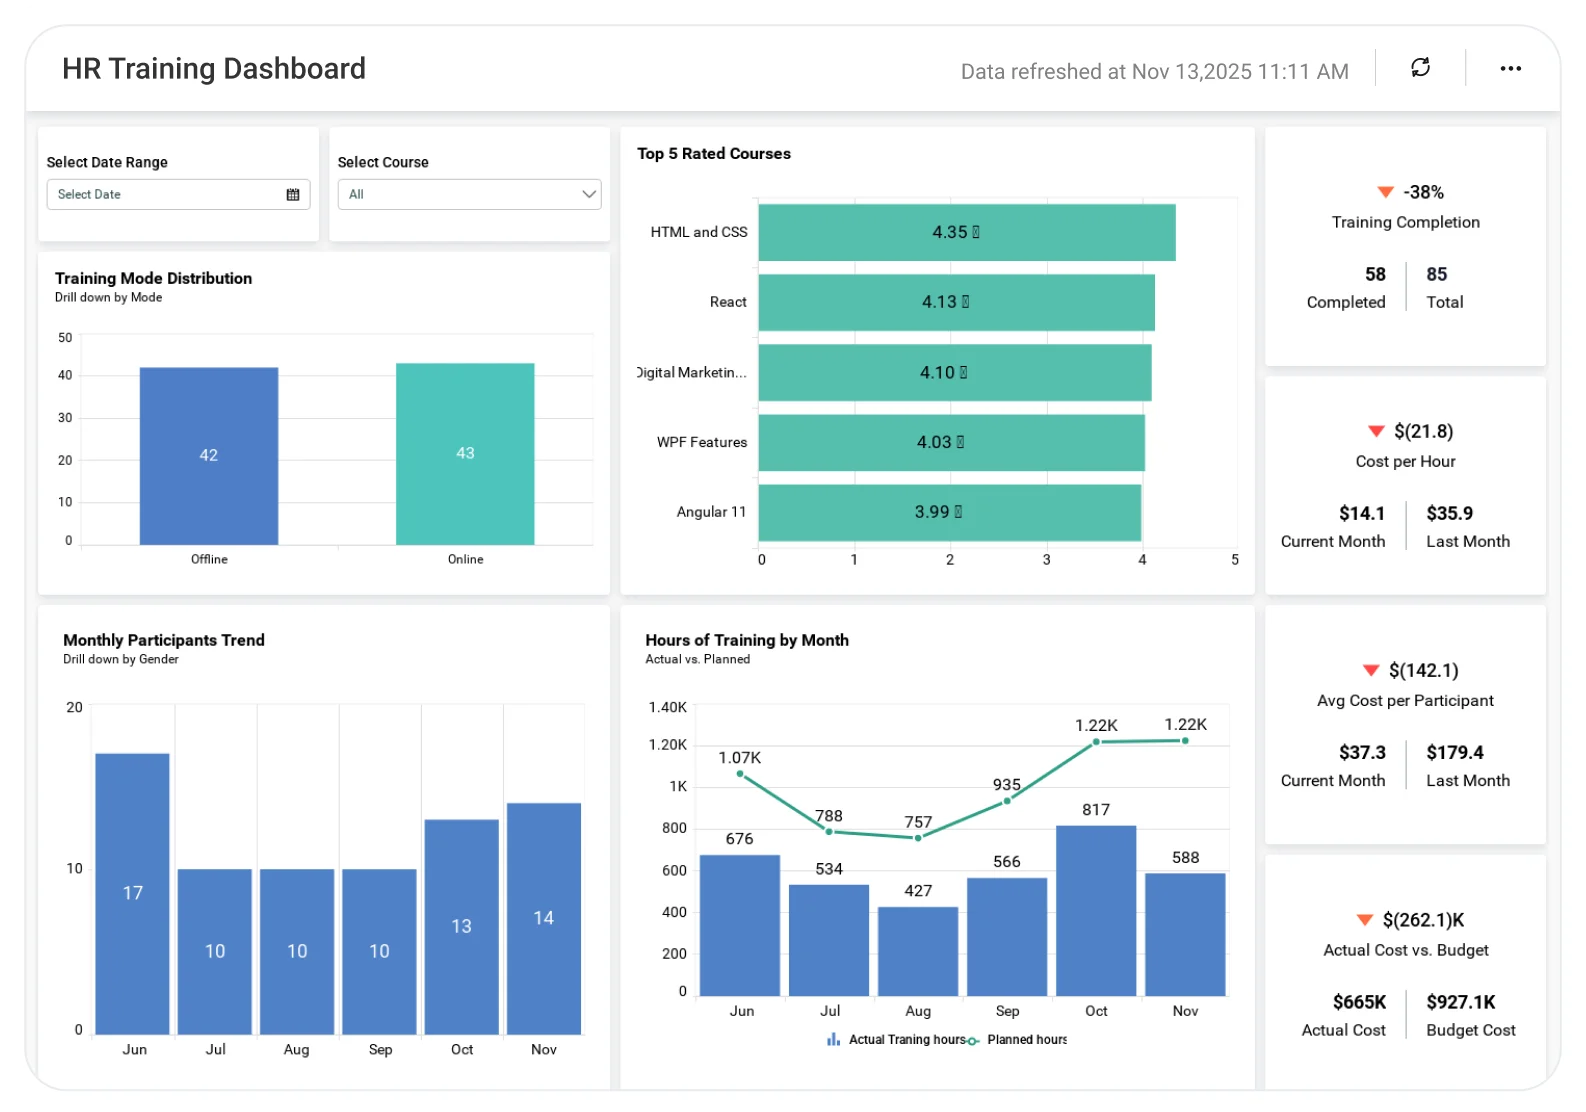
The Employee Training Dashboard helps HR and L&D teams analyze training participation, completion rates, and learning progress, enabling better program planning, improved employee skills, and stronger training impact.
TL;DR
-
Complete training visibility: Overall status, active vs. overdue courses.
-
Budget vs. actual cost: Track spend, spot overruns, and calculate cost-per-employee.
-
Course performance insights: See which courses are most completed, highest-rated, and driving success.
-
Completion analytics: Employee-level and course-level completion rates.
-
Executive view: Workforce readiness, skill gaps, and training ROI.
What Is a HR Training Dashboard?
An Employee Training Dashboard shows real-time insights into training progress, course effectiveness, compliance status, and L&D budget usage.
In Bold BI, this means interactive visuals that blend LMS, HRIS, and survey data automatically with no manual Excel reporting.
Example: Instantly compare completion rates across departments to identify skill gaps.
Why HR Training Dashboard Matters
Stop guessing training impact, gain a complete, real-time view of workforce readiness.
When training data is scattered across LMS exports, HRIS reports, and spreadsheets, L&D programs end up reactive instead of strategic.
Bold BI gives you one source of truth for learning performance so you can answer questions like:
-
Are employees completing the required courses on time?
-
Are we spending within the training budget?
-
Which courses deliver the most value?
-
How ready is the workforce for upcoming initiatives or compliance needs?
What You’ll Track
-
Overall training status: A real-time view of active, completed, and overdue courses, plus how ready your workforce is.
-
Training cost vs. budget: How your L&D spend compares to budget, including cost per course and cost per employee.
-
Course success analysis: Which courses perform best, how learners rate them, and where drop-offs happen.
-
Completion rates: Course-level and company-wide completion trends, showing how engaged different teams and regions are.
All dashboards are easily customizable so you can add your own KPIs, adjust thresholds, and blend in HR or performance data.
How It Works
-
Connect: LMS, HRIS, Excel, SQL, and SharePoint.
-
Choose the Employee Training sample dashboard and plug in your data.
-
Blend: Training and HR metrics to measure training ROI and workforce readiness.
-
Share: Role-based views for HR, managers, and executives.
-
Set alerts: For overdue training, budget overspend, or low completion rates.
Why Bold BI Is the Right Fit for HR Training Analytics
Bold BI brings all your learning, HR, and budget data into one secure dashboard so HR and L&D teams can view the training performance and program impact in a single place.
-
Combine LMS + HRIS + survey data into one dashboard.
-
Self-service analytics for HR teams, with granular controls for leadership.
-
Set it up in the cloud or on your own servers.
-
Add dashboards directly to your HR portals, intranet, SharePoint, or LMS.
Compare Options (at a glance)
| Feature | Bold BI | HR/LMS Reports | Spreadsheets |
|---|---|---|---|
| Training completion & compliance tracking | Yes | Limited | Manual |
| Course effectiveness (scores, feedback, pass rates) | Yes | Partial | Manual |
| Role/location/department drilldowns | Yes | Limited | Manual |
| Certification expiry & renewal monitoring | Yes | Limited | Manual |
| Custom KPIs & dashboards | Fully customizable | Fixed | Manual
|
Frequently Asked Questions
More Articles About HR Employee Training Dashboard
-
Employee Satisfaction Analysis with BI
 Explains how BI tools help improve employee satisfaction and engagement through data-driven insights.
-
Mastering Employee Turnover Analysis
Discusses how visualization helps HR teams reduce turnover and improve retention strategies.


