
HR Trainer Details Dashboard
Understand trainer expertise and workload to improve training effectiveness.
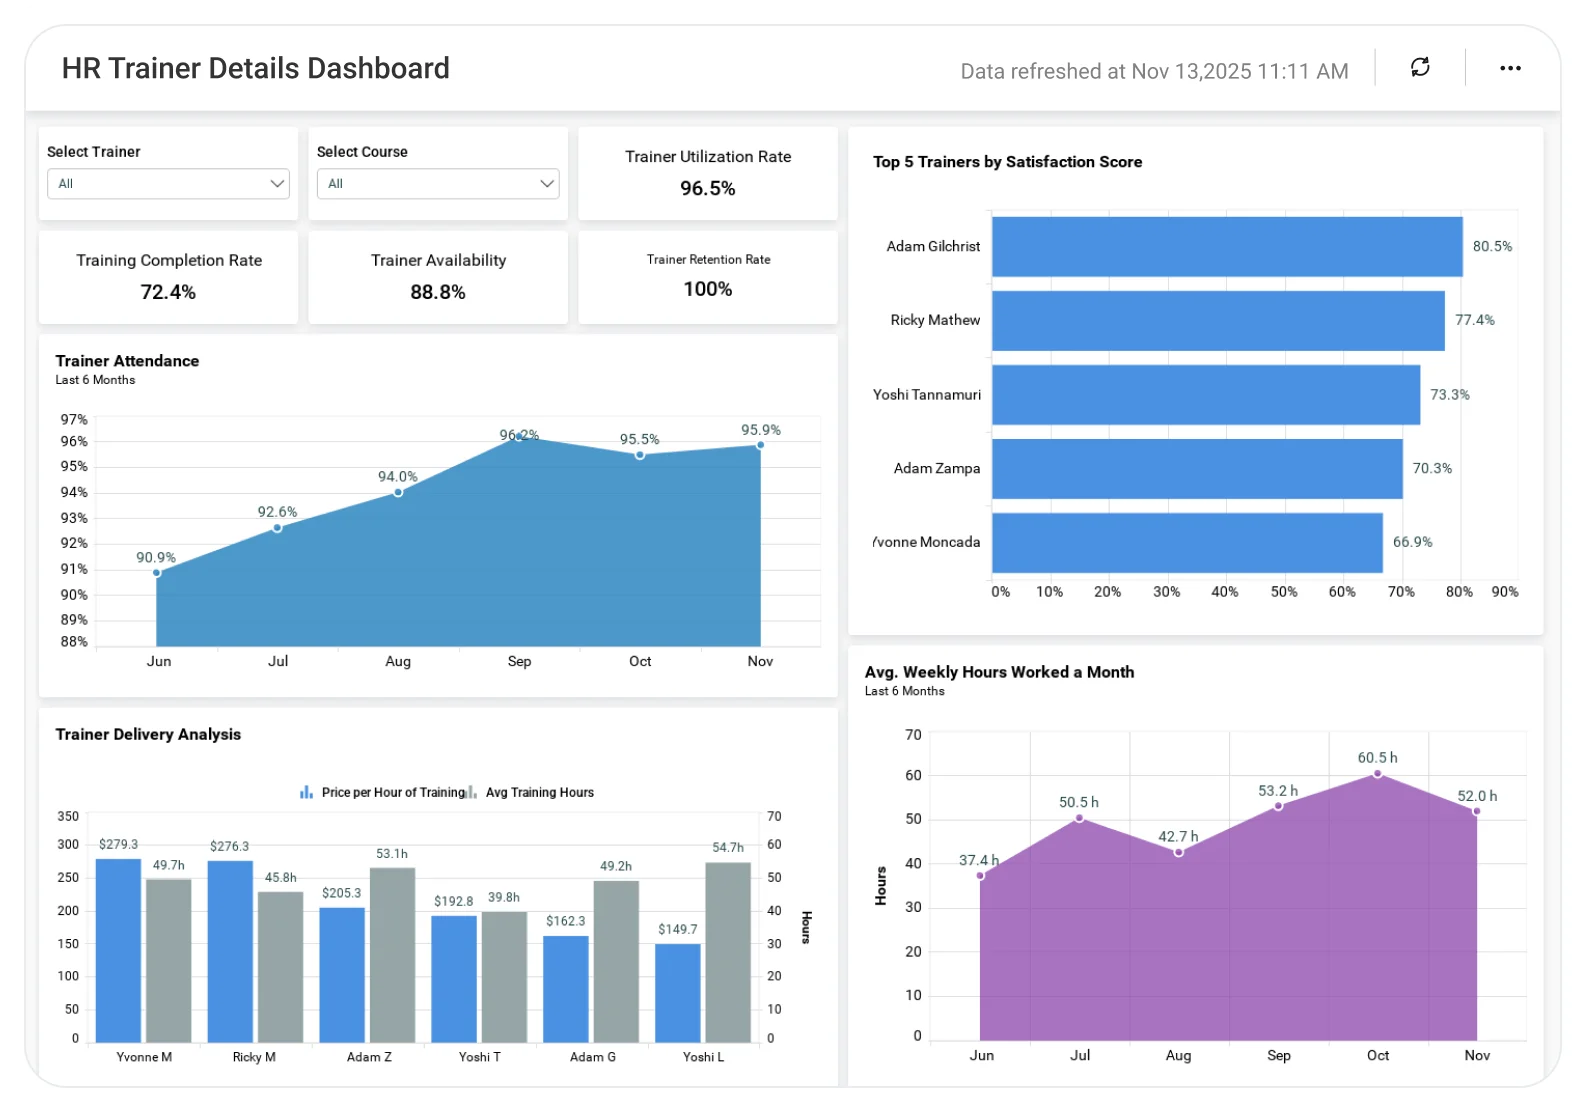
The Employee Trainer Details Dashboard helps HR and L&D teams analyze trainer profiles, session assignments, and training coverage, enabling better trainer utilization and more impactful learning programs.
TL;DR
-
Total annual training spends.
-
Average and total training hours per month.
-
Top five trainers by satisfaction ratings.
-
Training costs by course.
-
Trainee satisfaction, competency, and completion rates.
-
Trainer distribution by years of experience level.
What Is an HR Trainer Details Dashboard?
An HR Trainer Details Dashboard is a visual analytics tool that tracks trainer performance, training costs, course effectiveness, and total training hours.
In Bold BI, it becomes an interactive, customizable dashboard that helps HR teams evaluate trainers, optimize learning programs, and manage training investments more effectively.
Why Trainer Performance Analysis Matters
Training success depends heavily on trainer quality, course effectiveness, and cost control.
Without a centralized dashboard, HR teams struggle to answer critical questions like:
-
How much do we spend on training each year?
-
Which trainers deliver the highest satisfaction and competency outcomes?
-
Are our courses effective for trainees?
-
How many hours do employees spend on training each month?
The HR Trainer Details Dashboard answers these questions in one place thus helping HR leaders optimize trainer allocation and improve ROI from training programs.
What You’ll Track
-
Trainer performance & satisfaction: Track trainer ratings, satisfaction scores, and competency levels to identify high-performing trainers and those who need support.
-
Training costs & budget utilization: Monitor total annual training spend and cost by course to understand where budgets are allocated and control training expenses.
-
Training hours & learning effort: Analyze total and average training hours by month to understand employee learning effort and workload patterns.
-
Course effectiveness & completion: Evaluate course completion status, trainee competency outcomes, and overall course effectiveness to improve training quality.
-
Trainer experiences distribution: Understand trainer distribution by years of experience to balance expertise, capacity, and future training needs.
-
Trainer & course filters: Filter by trainer or course to instantly drill into specific data.
All dashboards are fully customizable so you can add KPIs or metrics as needed.
How It Works
-
Apply the HR Trainer Details Dashboard sample.
-
Blend trainer performance, cost, and training hour data.
-
Share dashboards securely with HR and L&D leadership.
-
Act on insights to improve trainer effectiveness and training ROI.
Why Bold BI Is the Right Fit for HR Trainer Details Analytics
-
Unified view of trainer performance, cost, and training effort.
-
Interactive charts with filters and drilldowns.
-
Executive-ready KPIs and visualizations.
-
Enterprise-grade security with Single Sign On, Role Based Access Control and Row Level Security.
-
Embeddable dashboards for HR and learning portals.
-
Cloud or self-hosted deployment options.
Compare Options( at a glance )
| Feature | Bold BI HR Trainer Details Dashboard | HR Systems / LMS Views | Spreadsheets |
| Trainer profile & skill visibility | Yes | Limited | Manual |
| Training sessions & workload tracking | Yes | Limited | Manual |
| Performance & feedback analysis | Yes | Limited | Manual |
| Interactive filtering & drilldowns | Yes | No | No |
| Shareable, management-ready dashboards | Yes | Limited | No |


