
Customer Ticket Traffic Management Dashboard
Understand ticket traffic patterns to manage workload and improve support efficiency.
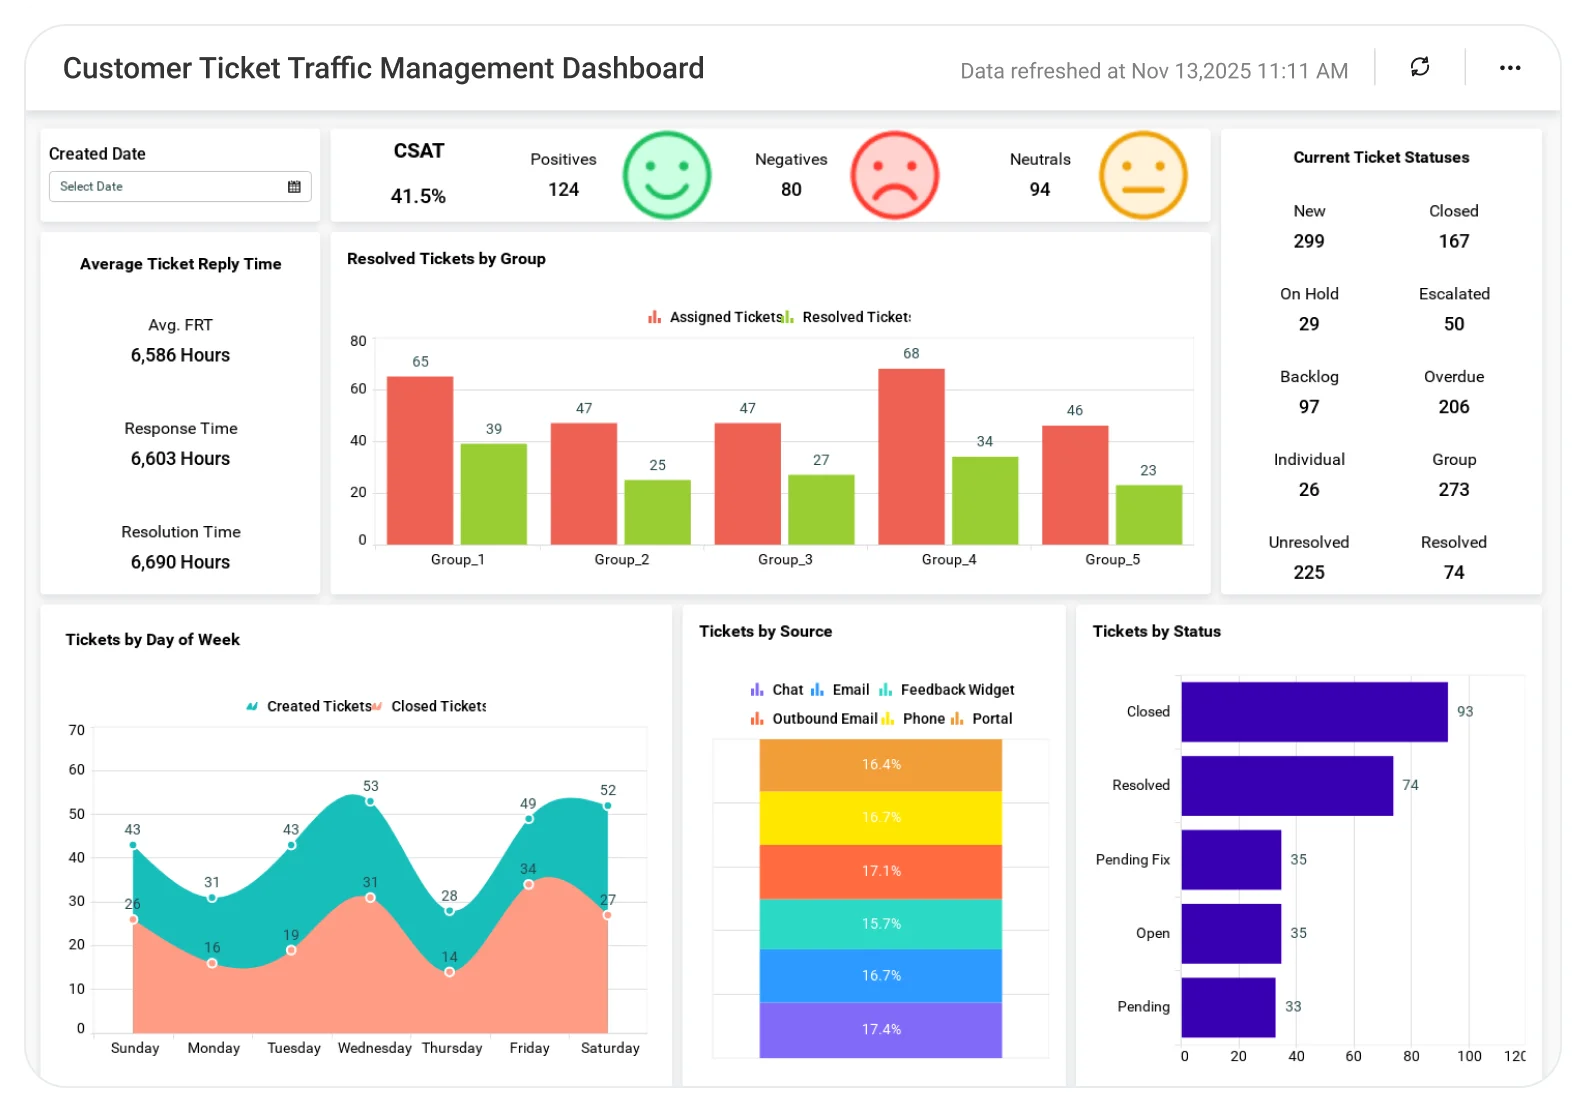
The Tickets Traffic Management Dashboard helps teams analyze incoming ticket volume, peak periods, and traffic distribution, enabling better resource allocation, faster responses, and smoother support operations.
TL;DR
-
Customer Experience Metrics: Track CSAT, NPS, retention, churn rate, and first contact resolution.
-
Ticket Operations KPIs: Response time, logged vs. resolved trends.
-
Workload Insights: Tickets by source, priority, and status.
-
Performance Analytics: Resolution time by group and agent.
-
Interactive Analysis: Drill down by date, channel, or agent.
What is a Customer Ticket Traffic Management Dashboard?
It provides a unified, real-time view of support ticket flow, customer satisfaction, team productivity, and resolution efficiency.
In Bold BI, this includes connected visualizations such as CSAT and NPS scores, ticket volume and workload charts, resolution time analytics, and churn indicators, all within one live dashboard.
Support teams can quickly identify bottlenecks, improve response times, and deliver higher levels of customer satisfaction.
Why Customer Ticket Traffic Management Matters
Support teams handle fluctuating ticket volumes across channels, priorities, and customers. Without clear visibility into incoming ticket traffic and resolution capacity, teams risk delayed responses, SLA breaches, and frustrated customers.
Effective ticket traffic management helps support leaders:
-
Anticipate spikes in ticket volume and plan resources proactively.
-
Balance workloads across teams and agents.
-
Reduce response and resolution delays.
-
Maintain consistent service quality during peak periods.
By turning ticket flow data into actionable insights, teams can stay in control of operations and deliver reliable customer support at scale.
What You’ll Track
Using Bold BI dashboards, you will track important KPIs such as:
-
Customer Experience KPIs: CSAT, NPS, retention, churn rate, sentiment (positive, neutral, negative), and first contact resolution.
-
Ticket Flow & Workload: Ticket volume by source (email, chat, portal, phone), priority, type, and status such as new, open, closed, escalated, overdue, and unassigned.
-
Response & Resolution Efficiency: First response time, average response time, resolution time, and logged vs. resolved tickets by team or agent.
-
Team & Channel Productivity: Tickets resolved by group, channel effectiveness, assigned vs. resolved trends, and time-to-close by category.
-
Trends & Patterns Over Time: Ticket creation vs. closure by day of week, resolution trends by team, and workload changes over time.
All dashboards are fully customizable, allowing you to add agent KPIs, SLA compliance, escalation metrics, or customer segments, and to filter by agent, group, channel, ticket type, or date range with real-time updates across every visualization.
How It Works
-
Choose the Ticket Traffic Management dashboard sample.
-
Blend ticket data, sentiment metrics, and team performance KPIs.
-
Share dashboards with support leaders, agents, and executives.
-
Set alerts for rising ticket volume, SLA breaches, or resolution delays.
Why Bold BI Is the Right Fit for Customer Ticket Traffic Management Analytics
Bold BI unifies ticket data, customer sentiment, and team performance into a single real-time dashboard, so support leaders can:
-
Monitor ticket volume, response times, and customer satisfaction together.
-
Identify workload imbalances and performance gaps quickly.
-
Connect support performance to retention and churn.
-
Make faster, data-driven decisions with confidence.
-
Deploy securely on the cloud or on-premises and embed dashboards easily into portals or project management tools.
-
Embed dashboards directly into Jira, internal portals, or customer systems.
Compare Options (at a glance)
| Feature | Bold BI | Helpdesk Tool Reports | Spreadsheets |
|---|---|---|---|
| Ticket volume & traffic trends | Yes | Limited | Manual |
| Channel mix (email/chat/phone/social) visibility | Yes | Partial | Manual |
| Peak hours & staffing demand insights | Yes | Limited | Manual |
| First response time & SLA tracking | Yes | Partial | Manual |
| Backlog, aging & queue health health monitoring | Yes Yes | Limited | Manual |
| Agent workload & throughput analysis | Yes | Partial | Manual |
| Custom KPIs & dashboards | Fully customizable | Fixed | Manual |
Frequently Asked Questions
More Articles About Customer Ticket Traffic Management Dashboard
-
Accelerate Business Growth Through Informed Decision-Making
 This blog explains how BI-driven insights help support teams make faster, smarter decisions to improve ticket handling and customer satisfaction.
-
Make Data-Driven Decisions with Business Analytics
This blog shows how analytics empowers support leaders to track KPIs like CSAT and resolution time for better operational efficiency.
-
Maximize Your Support Department Efficiency with Embedded Analytics
This blog discusses how embedded analytics streamlines ticket monitoring, enabling real-time visibility, and improved team performance.


