Department : Support

Nicereply Customer Satisfaction Dashboard for Support Managers

Improve customer experience by understanding satisfaction scores and service feedback.

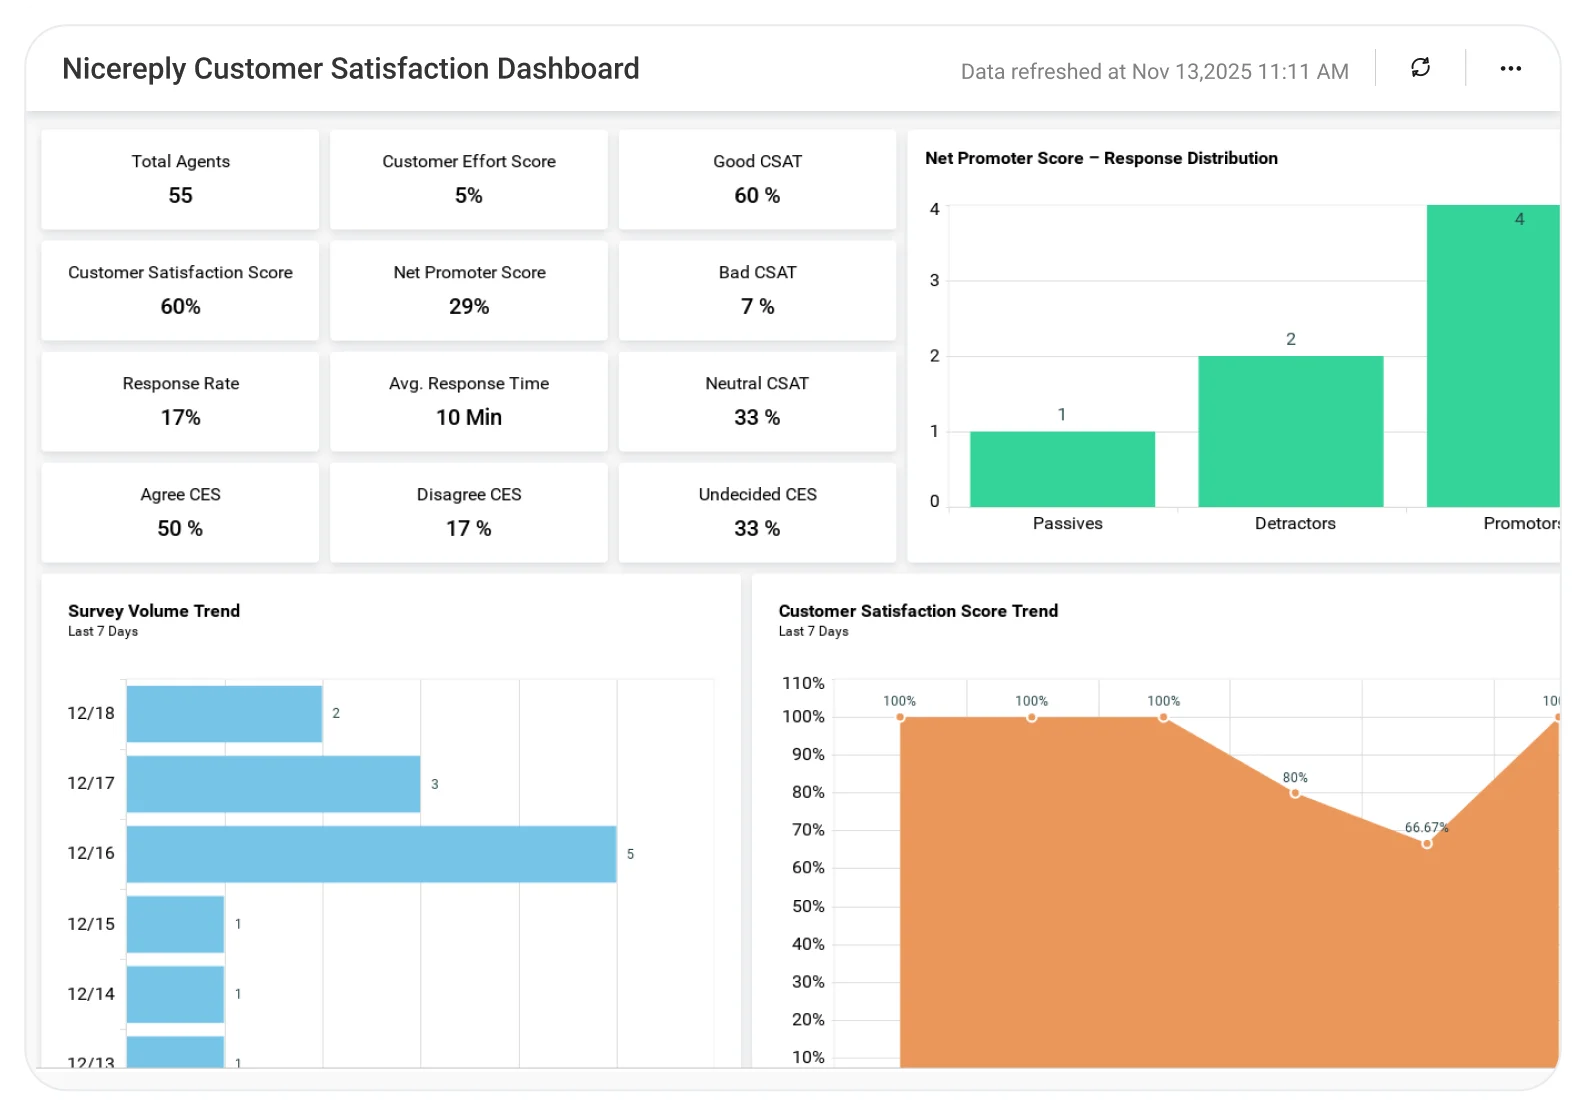
The Nicereply Customer Satisfaction Dashboard helps support teams analyze CSAT scores, feedback trends, and service performance, enabling targeted improvements that increase customer trust and loyalty.
TL;DR

  • Instant feedback insights: Get customer opinions as soon as they are expressed; rate and monitor customer replies via Nicereply.
  • Response time impact: Understand how ticket response time impacts customer satisfaction.
  • Rating trends: See how CSAT and NPS scores change over time and across teams.
  • Agent benchmarking: Performance and satisfaction can be compared either by agent or department.
  • Executive overview: Number of surveys responded, rating averaged, and sentiment distribution are all at your disposal.

What Is a Nicereply Customer Satisfaction Dashboard?

The Nicereply Customer Satisfaction Dashboard is a live reporting solution that support managers could use to get customer feedback, analyze the service quality, and strengthen the performance of the whole team. 

 In Bold BI, this includes having integrated charts, filters, and widgets that show the CSAT and NPS scores, monitor response times, and point out the areas where service can be improved.  

Why Nicereply Customer Satisfaction Dashboard Matters

The Nicereply Customer Satisfaction Dashboard gives support managers a powerful, easy-to-use tool for understanding customer feedback. It provides the data and analytics needed to identify trends, understand customer needs, and improve the overall support experience.

Designed for modern support teams, the dashboard brings key insights together in one place, helping you make informed decisions that strengthen customer satisfaction.

Key benefits include:

  • Easy tracking and monitoring of feedback.
  • Knowing how response time affects customer satisfaction.
  • Track rating trends over time.

What You’ll Track

  • Customer Satisfaction (CSAT): Average satisfaction score per agent or team.
  • Net Promoter Score (NPS): Measure customer loyalty and advocacy.
  • Feedback Volume: Track number of responses over time.
  • Response Time vs. Satisfaction: Understand how speed affects ratings.
  • Feedback Themes: Identify common praise and complaints.
  • Agent Performance: Compare ratings and ticket counts by individual.
  • Sentiment Analysis: Measure positive, neutral, and negative trends for a clear view of sentiment.

All dashboards are completely customizable, allowing you to include KPIs such as escalation rate or ticket backlog to match your objectives.

How It Works

  • Connect: Nicereply API, Zendesk, Freshdesk, or SQL data sources.
  • Choose the Nicereply Customer Satisfaction Dashboard sample.
  • Blend Combine feedback data with response metrics or customer profiles.
  • Share: Dashboards by role: agents, supervisors, executives.
  • Act fast: Alerts for low satisfaction or negative comments.

Why Bold BI Is the Right Fit for Nicereply Customer Satisfaction Analytics

  • Beyond standard Nicereply reports: Combine Nicereply feedback with support tickets, SLA, CRM, or QA data for complete customer experience visibility.
  • Deep drill-down insights: Move from overall satisfaction scores down to agent-level, product-level, region-level, or even individual feedback comments.
  • Custom, interactive visuals: Create your own widgets, gauges, and sentiment charts in minutes, with no rigid reporting limits.
  • Secure & governed sharing: Control access with role-based permissions and Single Sign On(SSO) to keep feedback data compliant and secure.
  • Embedded & flexible deployment: Embed dashboards directly into your support portal or CRM, and deploy securely in cloud or on-premises environments.

Compare Options (at a glance)

Feature Bold BI Nicereply Reports Spreadsheets
CSAT/NPS/CES trends & benchmarking Yes Limited Manual
Score breakdown by agent/team/channel Yes Partial Manual
Driver analysis (tags, topics, reasons) Yes Limited Manual
Low-score alerts & outlier detection Yes Partial Manual
Comment sentiment & theme insights Yes Limited Manual
Customer satisfaction vs. SLA correlations Yes Limited Manual
Custom KPIs & dashboards Fully customizable Fixed Manual

Frequently Asked Questions

Real-time syncing of feedback and reviews is made possible by the integration using Nicereply's REST API.
Yes. You can get complete support visibility by integrating data from Salesforce, Hubspot, Freshdesk, or Zendesk.
Yes Bold BI provides  SSO, as a security measure to ensure that only the intended person gets to see the right data.
In a matter of hours, Insightly will be connected and data will be visualized. The level of customization will be determined by how much data blending is done.
In as little as a few hours, you can link Nicereply and begin to visualize customer satisfaction data.
Yes. Change visuals, include KPIs, and apply filters according to your performance targets.

Compare Options (at a glance)

Feature Bold BI Nicereply Reports Spreadsheets
CSAT/NPS/CES trends & benchmarking Yes Limited Manual
Score breakdown by agent/team/channel Yes Partial Manual
Driver analysis (tags, topics, reasons) Yes Limited Manual
Low-score alerts & outlier detection Yes Partial Manual
Comment sentiment & theme insights Yes Limited Manual
Customer satisfaction vs. SLA correlations Yes Limited Manual
Custom KPIs & dashboards Fully customizable Fixed Manual

Simple Pricing That Grows With You

Say goodbye to hidden costs, complex quotes, and pricing guesswork.

Clear ROI from Day One

No complicated quotes—just honest, value-driven pricing that delivers more for less, right from the start.

Built to Grow with You

From startup to scale-up, Bold BI grows with your business — no forced upgrades, just flexible, future-ready analytics.

Fits Every Budget

Whether you're a startup or an enterprise, our flexible pricing scales with your growth— Pay only for what you truly need.

Trusted & recognized

Analytics that wins awards and users.

Recognized by G2, TrustRadius and Visual Studio Magazine for delivering standout performance and value.

I appreciate Bold BI for making it easier to provide reporting for our customers, allowing both our analysts and customers to easily build and publish reports. The ability to build dashboards and modify queries for specific outcomes is very user-friendly. I value the mobile readiness of the app and its integration capabilities with API structures. The addition of AI features is impressive. The economic pricing model and the effective partnership, which includes consistent and helpful support, make it an invaluable tool for our OEM model.

Ravi S.

The support from Bold is unmatched. They do not charge extra for support and it is excellent anyway. All our tickets and questions are quickly answered with authoritative and precise guidance. This is important at the product is complex, powerful and mature. To get the most out of the tool, the level of support they provide is essential.

Murph M.

It was easy to implement data visualizations into our product. The standard widgets allowed us to build professional looking dashboards, and a robust API provided excellent control of the development and runtime process from within our application.

Scott Y.

RECOGNITION

Users Love Us

Visual Studio Reader's Choice - 2025

Leader - Fall 2025

High Performer - Fall 2025 EMEA

Regional Leader - Fall 2025 AMERICAS

TrustRadius Tech Cares

Capterra - 4.9/5

G2- 4.3/5

GetApp - 4.9/5

Software Advice - 4.4/5

Frequently Asked Questions

Real-time syncing of feedback and reviews is made possible by the integration using Nicereply's REST API.
Yes. You can get complete support visibility by integrating data from Salesforce, Hubspot, Freshdesk, or Zendesk.
Yes Bold BI provides  SSO, as a security measure to ensure that only the intended person gets to see the right data.
In a matter of hours, Insightly will be connected and data will be visualized. The level of customization will be determined by how much data blending is done.
In as little as a few hours, you can link Nicereply and begin to visualize customer satisfaction data.
Yes. Change visuals, include KPIs, and apply filters according to your performance targets.
Ready to Get Started?

Start your 30-day free trial instantly

Easy integration, AI-Powered Dashboards and 24x5 real-time support.