Department : Support

Live Call Center Dashboard

Understand live call center activity to improve response efficiency and customer experience.

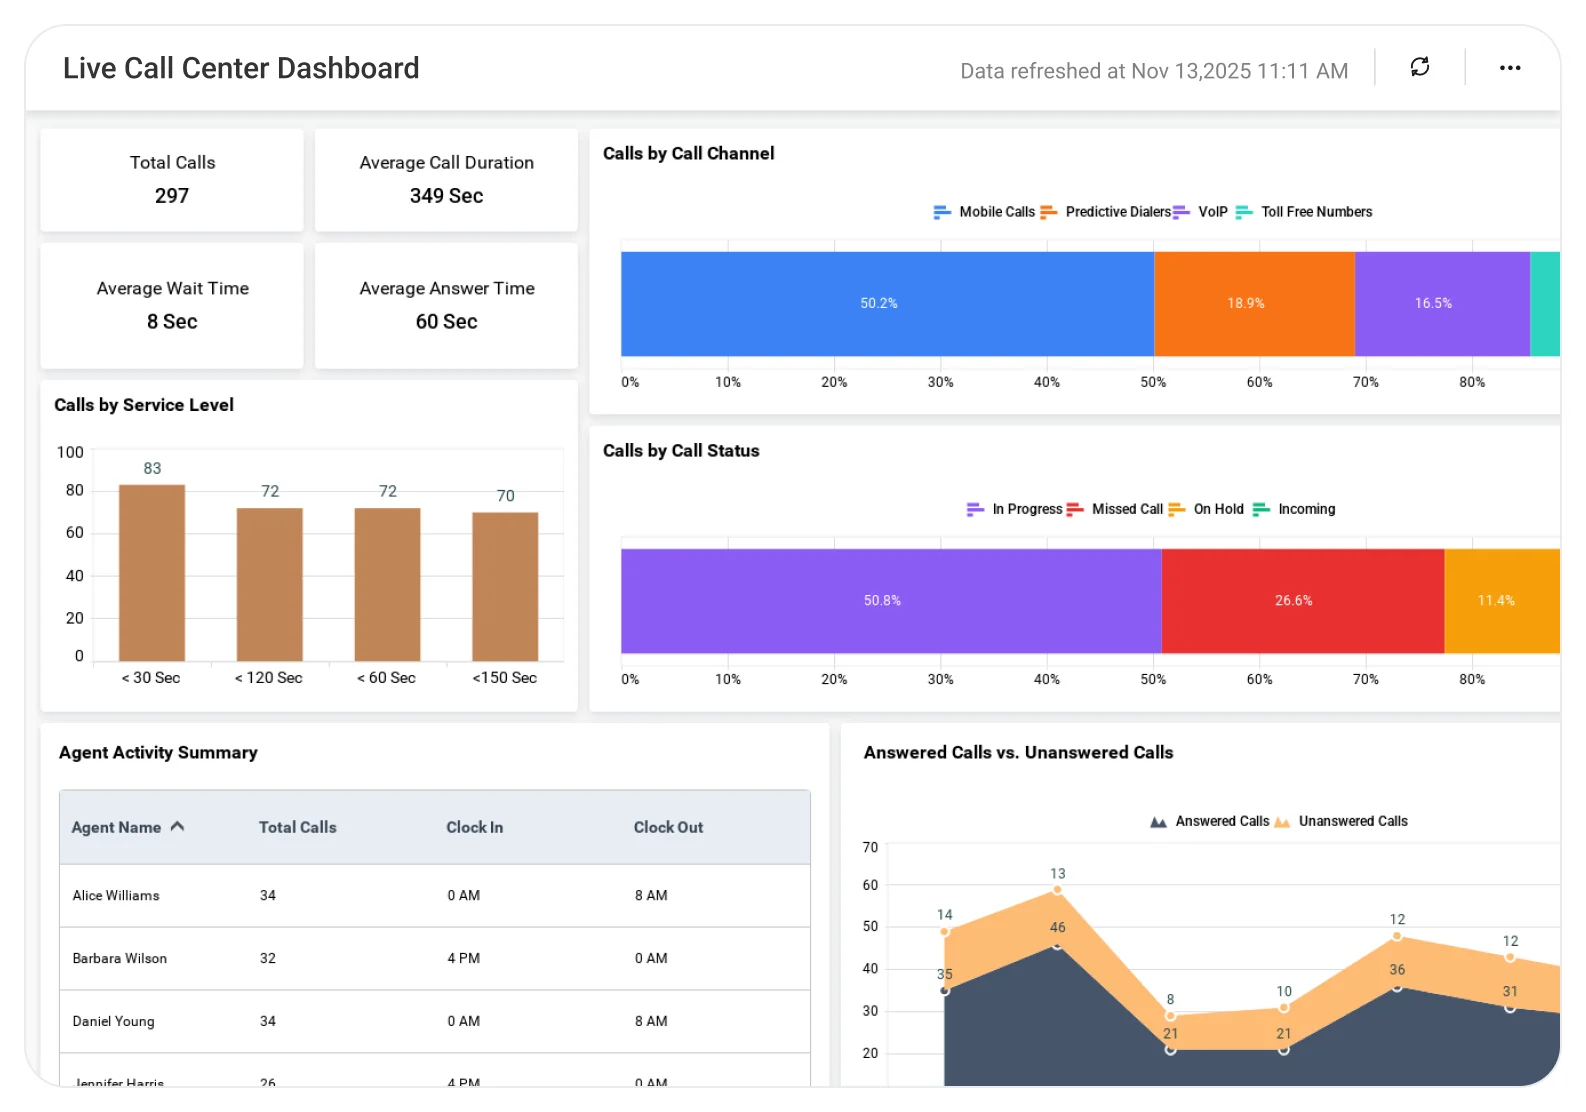
The Live Call Centre Dashboard helps support teams analyze call volume, wait times, agent availability, and call handling performance, enabling better staffing decisions, faster responses, and improved service quality.
TL;DR

  • Monitor live inbound and outbound call volumes to stay ahead of demand spikes.
  • Track real-time queue status and customer wait times to protect service levels.
  • View active, idle, and available agent counts to rebalance staffing instantly.
  • Identify ongoing calls and SLA risks in real time to prevent breaches before they occur.
  • Enable faster floor-level decisions that reduce wait times and maintain customer experience.

What Is a Live Call Center Dashboard?

A Live Call Center Dashboard is a real-time analytics view that shows the current state of call center operations, including calls in progress, queues building up, and agent availability, without waiting for end‑of‑day or hourly reports.

With Bold BI, live data from call center platforms and support systems is streamed into a single dashboard, giving supervisors and operations teams instant situational awareness to act in the moment.

Why Live Call Center Dashboard Matters

Call center performance can change minute by minute. 

When teams rely only on historical or delayed reports: 

  • Queue overloads escalate unnoticed.
  • SLA breaches happen before action is taken.
  • Agents sit idle in one queue while others overflow.
  • Customer wait times increase unnecessarily.

A live dashboard enables teams to move from reactive damage control to real-time operational control. 

What You’ll Track

Using Bold BI dashboards, you will track important KPIs such as:

  • Live call volume & queue load: Calls waiting, in progress, and completed to understand real-time demand.
  • Agent availability & utilization: Active, idle, and logged-in agents to support quick rebalancing.
  • Current wait time & SLA status: Real-time wait times and SLA indicators to prevent breaches.
  • Call handling flow: Ongoing calls by queue or channel to monitor operational pressure points.

All samples are easy to tailor, allowing you to add your own KPIs or connect data from any department.

How It Works

  • Connect live data feeds from call center platforms and support systems using REST APIs to Bold BI.
  • Apply the Live Call Center Dashboard sample.
  • Stream real-time call, queue, and agent activity into dashboards.
  • Monitor insights by queue, channel, or team.
  • Display dashboards on wallboards or share with supervisors and managers.

Why Bold BI Is the Right Fit for Live Call Center Analytics

  • Provides instant visibility into live operations: Shows exactly what’s happening across queues and agents without delay.
  • Helps prevent SLA breaches before they occur: Makes rising wait times and queue overload visible early so teams can act immediately.
  • Supports fast, informed floor-level decisions: Enables supervisors to reroute calls, rebalance agents, or escalate staffing in real time.
  • Improves coordination across teams and shifts: Keeps everyone aligned with the same live operational view during peak hours.
  • Scales for high-volume, multi-queue contact centers: Designed for environments where real-time responsiveness is critical.

Compare Options (at a glance)

Feature Bold BI Call Center Live Views Spreadsheets
Real-time call & queue visibility  Yes Partial No
Live agent availability tracking  Yes Limited No
SLA risk monitoring  Yes Limited No
Wallboard-ready dashboards  Yes Limited No
Custom KPIs & layouts  Fully customizable Fixed No

Frequently Asked Questions

Yes. The dashboard is designed to reflect live call, queue, and agent activity as data updates.
Supervisors, floor managers, operations leads, and NOC-style support teams use it for real-time monitoring.
Yes. The dashboard works well for wallboard displays and shared monitoring screens.
No. It complements them by focusing on live operations rather than past performance.
Yes. Multiple queues and channels can be viewed together or filtered as needed.
Absolutely. Live visibility is especially valuable during spikes, outages, or incident response periods.

Compare Options (at a glance)

Feature Bold BI Call Center Live Views Spreadsheets
Real-time call & queue visibility  Yes Partial No
Live agent availability tracking  Yes Limited No
SLA risk monitoring  Yes Limited No
Wallboard-ready dashboards  Yes Limited No
Custom KPIs & layouts  Fully customizable Fixed No

Simple Pricing That Grows With You

Say goodbye to hidden costs, complex quotes, and pricing guesswork.

Clear ROI from Day One

No complicated quotes—just honest, value-driven pricing that delivers more for less, right from the start.

Built to Grow with You

From startup to scale-up, Bold BI grows with your business — no forced upgrades, just flexible, future-ready analytics.

Fits Every Budget

Whether you're a startup or an enterprise, our flexible pricing scales with your growth— Pay only for what you truly need.

Trusted & recognized

Analytics that wins awards and users.

Recognized by G2, TrustRadius and Visual Studio Magazine for delivering standout performance and value.

I appreciate Bold BI for making it easier to provide reporting for our customers, allowing both our analysts and customers to easily build and publish reports. The ability to build dashboards and modify queries for specific outcomes is very user-friendly. I value the mobile readiness of the app and its integration capabilities with API structures. The addition of AI features is impressive. The economic pricing model and the effective partnership, which includes consistent and helpful support, make it an invaluable tool for our OEM model.

Ravi S.

The support from Bold is unmatched. They do not charge extra for support and it is excellent anyway. All our tickets and questions are quickly answered with authoritative and precise guidance. This is important at the product is complex, powerful and mature. To get the most out of the tool, the level of support they provide is essential.

Murph M.

It was easy to implement data visualizations into our product. The standard widgets allowed us to build professional looking dashboards, and a robust API provided excellent control of the development and runtime process from within our application.

Scott Y.

RECOGNITION

Users Love Us

Visual Studio Reader's Choice - 2025

Leader - Fall 2025

High Performer - Fall 2025 EMEA

Regional Leader - Fall 2025 AMERICAS

TrustRadius Tech Cares

Capterra - 4.9/5

G2- 4.3/5

GetApp - 4.9/5

Software Advice - 4.4/5

Frequently Asked Questions

Yes. The dashboard is designed to reflect live call, queue, and agent activity as data updates.
Supervisors, floor managers, operations leads, and NOC-style support teams use it for real-time monitoring.
Yes. The dashboard works well for wallboard displays and shared monitoring screens.
No. It complements them by focusing on live operations rather than past performance.
Yes. Multiple queues and channels can be viewed together or filtered as needed.
Absolutely. Live visibility is especially valuable during spikes, outages, or incident response periods.
Ready to Get Started?

Start your 30-day free trial instantly

Easy integration, AI-Powered Dashboards and 24x5 real-time support.