Department : Marketing

Salesforce Marketing Leads Dashboard

Understand marketing lead performance to improve lead quality and conversion outcomes.

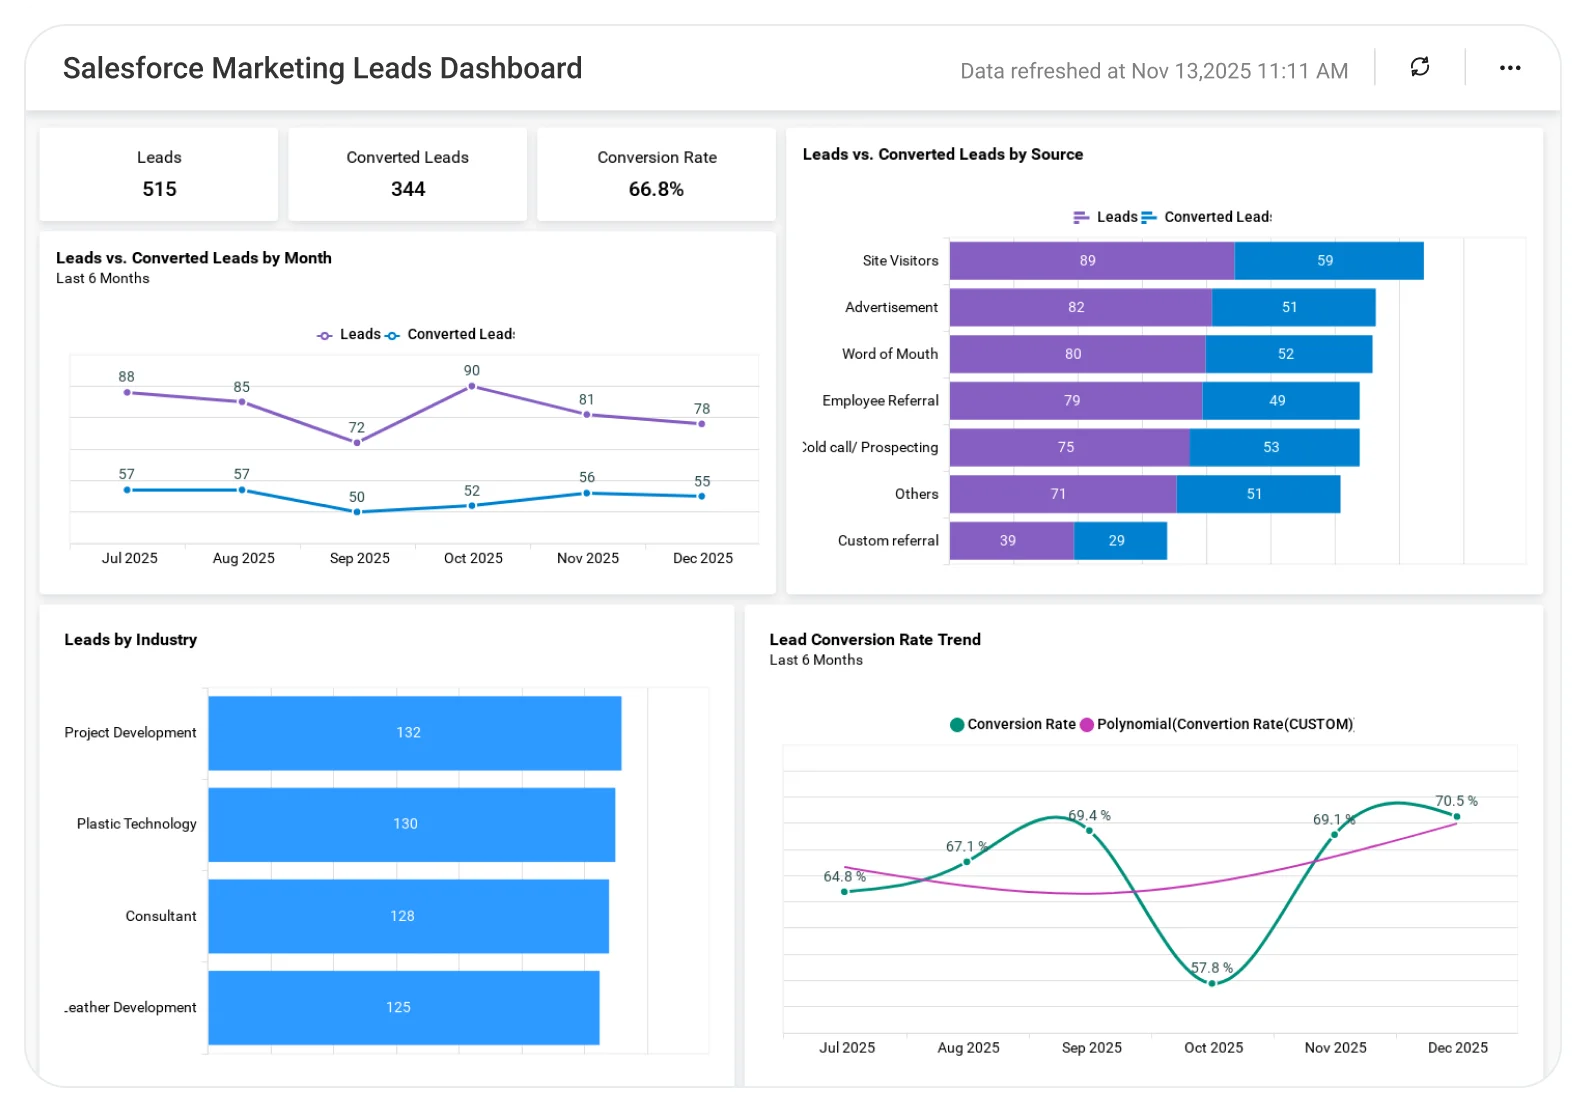
The Salesforce Marketing Leads Dashboard helps teams analyze lead sources, lead status, conversion rates, and campaign impact, enabling better lead prioritization, improved nurturing strategies, and stronger marketing results.

TL;DR

  • Total leads vs. converted leads at a glance.
  • Monthly lead and conversion trends.
  • Lead sources and source-wise conversion performance.
  • Conversion rate tracking over time.
  • Lead distribution by industry and country.
  • Drilldowns from monthly to daily lead activity.

What Is a Salesforce Marketing Leads Dashboard?

A Salesforce Marketing Leads Dashboard is a visual analytics tool that tracks lead volume, sources, conversion rates, and demographic breakdowns using Salesforce data.

In Bold BI, this means interactive charts, drilldowns, filters, and real-time updates that help marketing and sales teams evaluate lead quality and campaign effectiveness in one unified view.

Why Salesforce Marketing Leads Dashboard Matters

Salesforce stores a wealth of lead data, but reviewing it through standard reports can be time-consuming and fragmented.

With Bold BI’s Salesforce Marketing Leads Dashboard, teams can quickly answer questions like:

  • How many leads and converted leads do we have this month?
  • Which lead sources generate the highest-quality leads?
  • How is our conversion rate trending month after month?
  • Which industries and countries drive the most leads?
  • Where should we focus on future ad spend and campaigns?

This visibility supports better targeting, stronger marketing and sales alignment, and more efficient campaign spend.

What You’ll Track

Using Bold BI dashboards, you will track important salesforce marketing KPIs such as:

  • Lead & conversion overview: Monitor total leads, converted leads, and monthly performance at a glance.
  • Lead source performance: Track leads created and converted by each marketing channel over time.
  • Conversion rate trends: Analyze monthly conversion rates to assess lead quality and campaign impact.
  • Industry & country distribution: Understand which industries and regions contribute the most leads.

All dashboards are fully customizable so you can add KPIs or metrics as needed.

How It Works

  • Connect Salesforce and other marketing data, or exported Excel/SQL databases.
  • Apply the Project Performance Dashboard sample.Salesforce Marketing Leads Dashboard sample.
  • Blend lead, campaign, and regional data for deeper insight.
  • Share dashboards securely with marketing, sales, and leadership teams.
  • Act velocity trends over time.on insights to optimize targeting, campaigns, and conversions.

Why Bold BI Is the Right Fit for Salesforce Marketing Leads Analytics

Bold BI gives you portfolio-wide analytics, governed sharing, and deep drilldown capabilities Trello’s built-in reporting doesn’t offer.

Compare Options (at a glance)

Feature Bold BI Salesforce Native Dashboards Spreadsheets / Manual Reporting
Lead funnel visibility (new → MQL → SQL → won/lost) Yes Yes (standard) Manual
Campaign & channel performance (source ROI, CPL, CAC) Yes Limited (often needs customization) Manual
Lead quality scoring & segmentation Yes Partial Manual
Trend analysis & forecasting (pipeline influence over time) Yes Limited Manual
Custom KPIs & dashboards Fully customizable Customizable (within SF limits) Manual

Frequently Asked Questions

Yes. You can add, remove, or modify KPIs, charts, and filters to match your lead management and reporting needs.
Absolutely. Use RBAC and Row Level Security (RLS) to show relevant data to each team.
Once connected, data refreshes automatically based on your schedules—no manual exports required.
Yes. Bold BI supports secure embedding so dashboards can live directly inside CRMs or internal tools.
Most teams connect Salesforce and start analyzing leads within a few hours.

Compare Options (at a glance)

Feature Bold BI Salesforce Native Dashboards Spreadsheets / Manual Reporting
Lead funnel visibility (new → MQL → SQL → won/lost) Yes Yes (standard) Manual
Campaign & channel performance (source ROI, CPL, CAC) Yes Limited (often needs customization) Manual
Lead quality scoring & segmentation Yes Partial Manual
Trend analysis & forecasting (pipeline influence over time) Yes Limited Manual
Custom KPIs & dashboards Fully customizable Customizable (within SF limits) Manual

Simple Pricing That Grows With You

Say goodbye to hidden costs, complex quotes, and pricing guesswork.

Clear ROI from Day One

No complicated quotes—just honest, value-driven pricing that delivers more for less, right from the start.

Built to Grow with You

From startup to scale-up, Bold BI grows with your business — no forced upgrades, just flexible, future-ready analytics.

Fits Every Budget

Whether you're a startup or an enterprise, our flexible pricing scales with your growth— Pay only for what you truly need.

Trusted & recognized

Analytics that wins awards and users.

Recognized by G2, TrustRadius and Visual Studio Magazine for delivering standout performance and value.

I appreciate Bold BI for making it easier to provide reporting for our customers, allowing both our analysts and customers to easily build and publish reports. The ability to build dashboards and modify queries for specific outcomes is very user-friendly. I value the mobile readiness of the app and its integration capabilities with API structures. The addition of AI features is impressive. The economic pricing model and the effective partnership, which includes consistent and helpful support, make it an invaluable tool for our OEM model.

Ravi S.

The support from Bold is unmatched. They do not charge extra for support and it is excellent anyway. All our tickets and questions are quickly answered with authoritative and precise guidance. This is important at the product is complex, powerful and mature. To get the most out of the tool, the level of support they provide is essential.

Murph M.

It was easy to implement data visualizations into our product. The standard widgets allowed us to build professional looking dashboards, and a robust API provided excellent control of the development and runtime process from within our application.

Scott Y.

RECOGNITION

Users Love Us

Visual Studio Reader's Choice - 2025

Leader - Fall 2025

High Performer - Fall 2025 EMEA

Regional Leader - Fall 2025 AMERICAS

TrustRadius Tech Cares

Capterra - 4.9/5

G2- 4.3/5

GetApp - 4.9/5

Software Advice - 4.4/5

Frequently Asked Questions

Yes. You can add, remove, or modify KPIs, charts, and filters to match your lead management and reporting needs.
Absolutely. Use RBAC and Row Level Security (RLS) to show relevant data to each team.
Once connected, data refreshes automatically based on your schedules—no manual exports required.
Yes. Bold BI supports secure embedding so dashboards can live directly inside CRMs or internal tools.
Most teams connect Salesforce and start analyzing leads within a few hours.
Ready to Get Started?

Start your 30-day free trial instantly

Easy integration, AI-Powered Dashboards and 24x5 real-time support.