
Marketing Performance Dashboard
Understand marketing performance to improve campaign effectiveness and ROI.
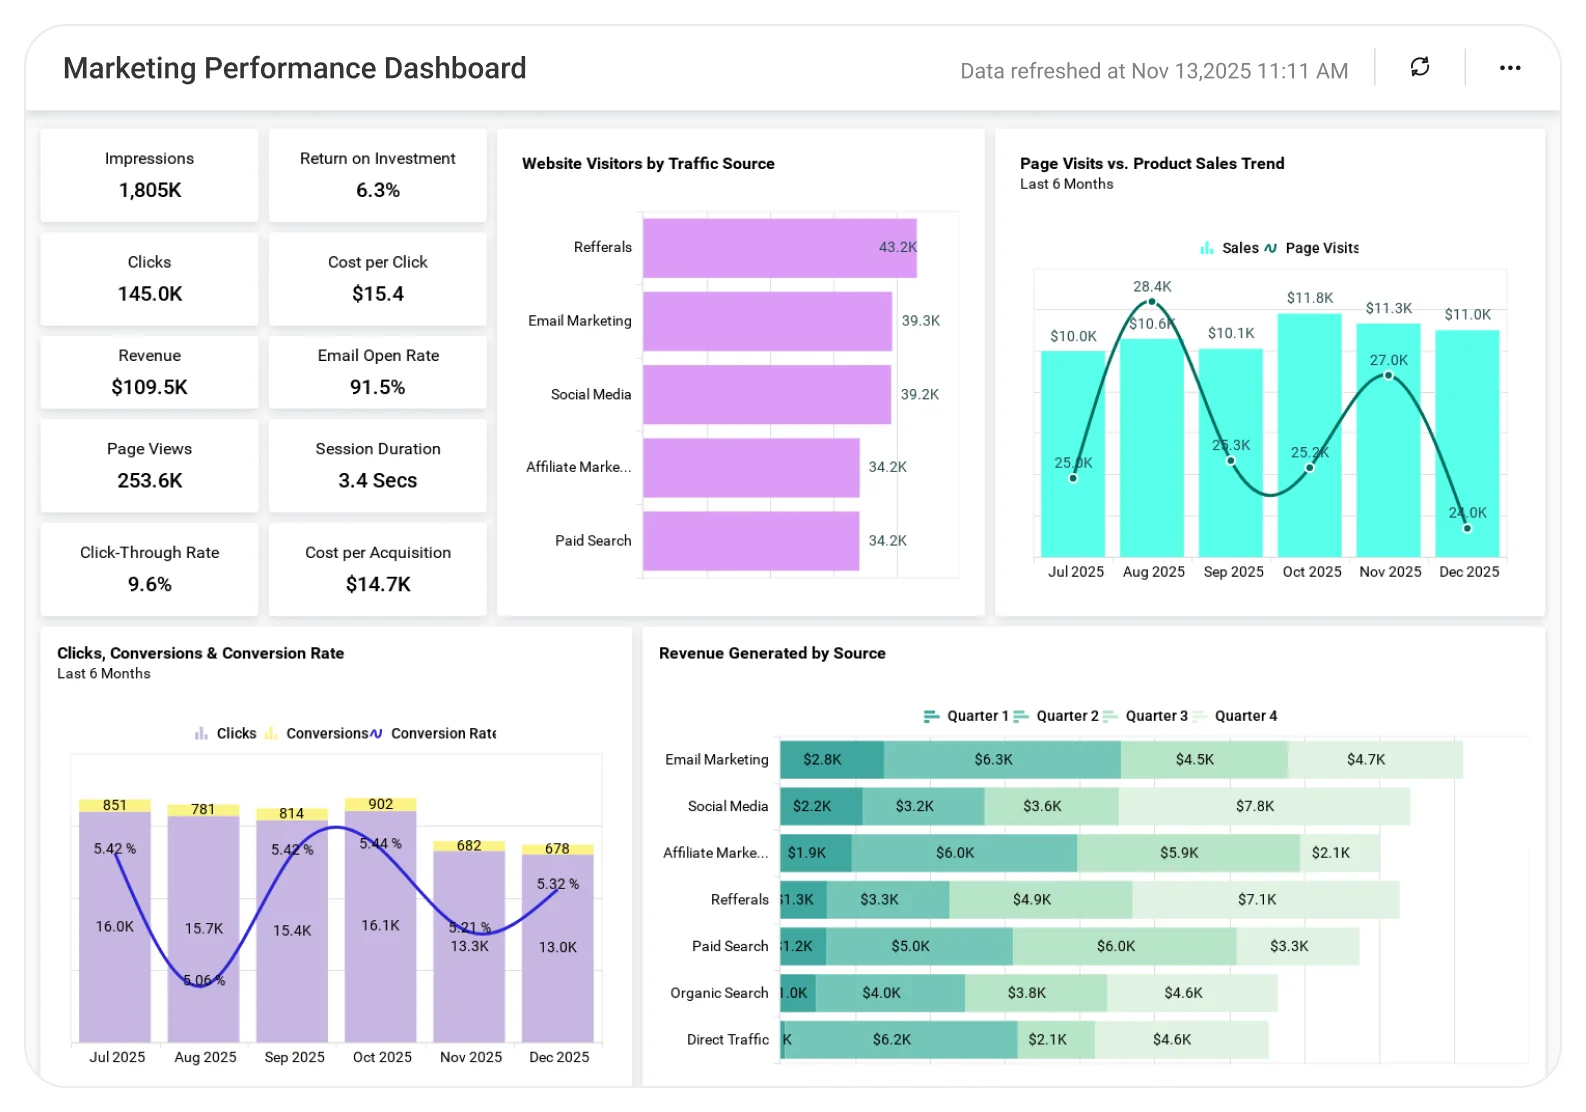
The Marketing Performance Dashboard helps teams analyze campaign results, channel performance, leads, and conversions, enabling better budget allocation, data-driven strategy decisions, and improved marketing outcomes.
TL;DR
-
Total website visitors and weekly traffic trends.
-
Lead conversion and click-through rates.
-
Top revenue-generating traffic sources.
-
Product usage and active customer insights.
-
Marketing ROI, dormancy rate, and customer acquisition cost.
-
A single, executive-ready view of marketing performance.
What Is a Marketing Performance Dashboard?
A Marketing Performance Analysis Dashboard is a visual analytics tool that tracks website traffic, conversions, revenue sources, customer activity, and ROI.
In Bold BI, it becomes an interactive, customizable dashboard that helps marketing teams evaluate performance across channels and tie marketing efforts directly to business outcomes.
Why Marketing Performance Dashboard Matters
Marketing success isn’t just about traffic; it’s about turning visitors into customers and revenue.
Without a consolidated view, teams struggle to answer key questions like:
-
How many customers are visiting our website?
-
Are our leads converting effectively?
-
Which channels drive the most revenue?
-
How many customers actively use our products?
-
What is our true marketing return on investment?
The Marketing Performance Analysis Dashboard answers these questions in one place, helping teams make faster, data-driven decisions.
What You’ll Track
-
Website Traffic & Trends: Track total visitors and weekly traffic patterns to spot spikes, drops, and campaign-driven changes.
-
Conversion & Engagement Quality: Monitor lead conversion rates, click-through rates by channel, and top revenue-generating traffic sources.
-
Revenue & ROI Performance:Analyze marketing ROI, customer acquisition cost (CAC), and dormancy rate to measure true campaign impact.
-
Customer Activity Insights: Understand active vs. inactive customers to identify retention and re-engagement opportunities.
All dashboards are fully customizable so you can add KPIs or metrics as needed.
How It Works
-
Connect web analytics, CRM, and marketing data sources.
-
Apply the Marketing Performance Analysis Dashboard sample.
-
Blend traffic, conversion, revenue, and customer data.
-
Share dashboards securely with marketing teams and executives.
-
Act on insights to optimize campaigns and improve ROI.
Why Bold BI Is the Right Fit for Marketing Performance Analytics
-
Unified view of traffic, conversion, revenue, and ROI.
-
Interactive charts with filters and drilldowns.
-
Executive-ready KPIs and visuals.
-
Enterprise-grade security with Single Sign On, Role Based Access Control and Row Level Security.
-
Embeddable dashboards for internal marketing portals.
-
Cloud or self-hosted deployment options.
Compare Options (at a glance)
| Feature | Bold BI | Native Marketing Tools | Spreadsheets |
| Channel-wise ROI analysis | Yes | Partial | Manual |
| Cross-channel performance comparison | Yes | No | Manual |
| Interactive filtering & drilldowns | Yes | Limited | No |
| Shareable, executive-ready dashboards | Yes | Limited | No |
Frequently Asked Questions
More Articles About Marketing Analytics Dashboard
-
Sculpting Success with Marketing Analytics Mastery
 This blog explains the foundations of marketing analytics, key marketing KPIs such as CTR, conversion rate, traffic sources, clicks vs. conversions, and how dashboards help marketers improve ROI and decision making.
-
Maximize Marketing Department Efficiency with Embedded Analytics
Focuses on how embedded marketing dashboards (including performance analysis dashboards) help track visitor count, CAC, marketing ROI, bounce rates, and revenue KPIs directly inside marketing applications.


