
Google Analytics Website Traffic
Understand website traffic patterns to improve engagement and conversion performance.
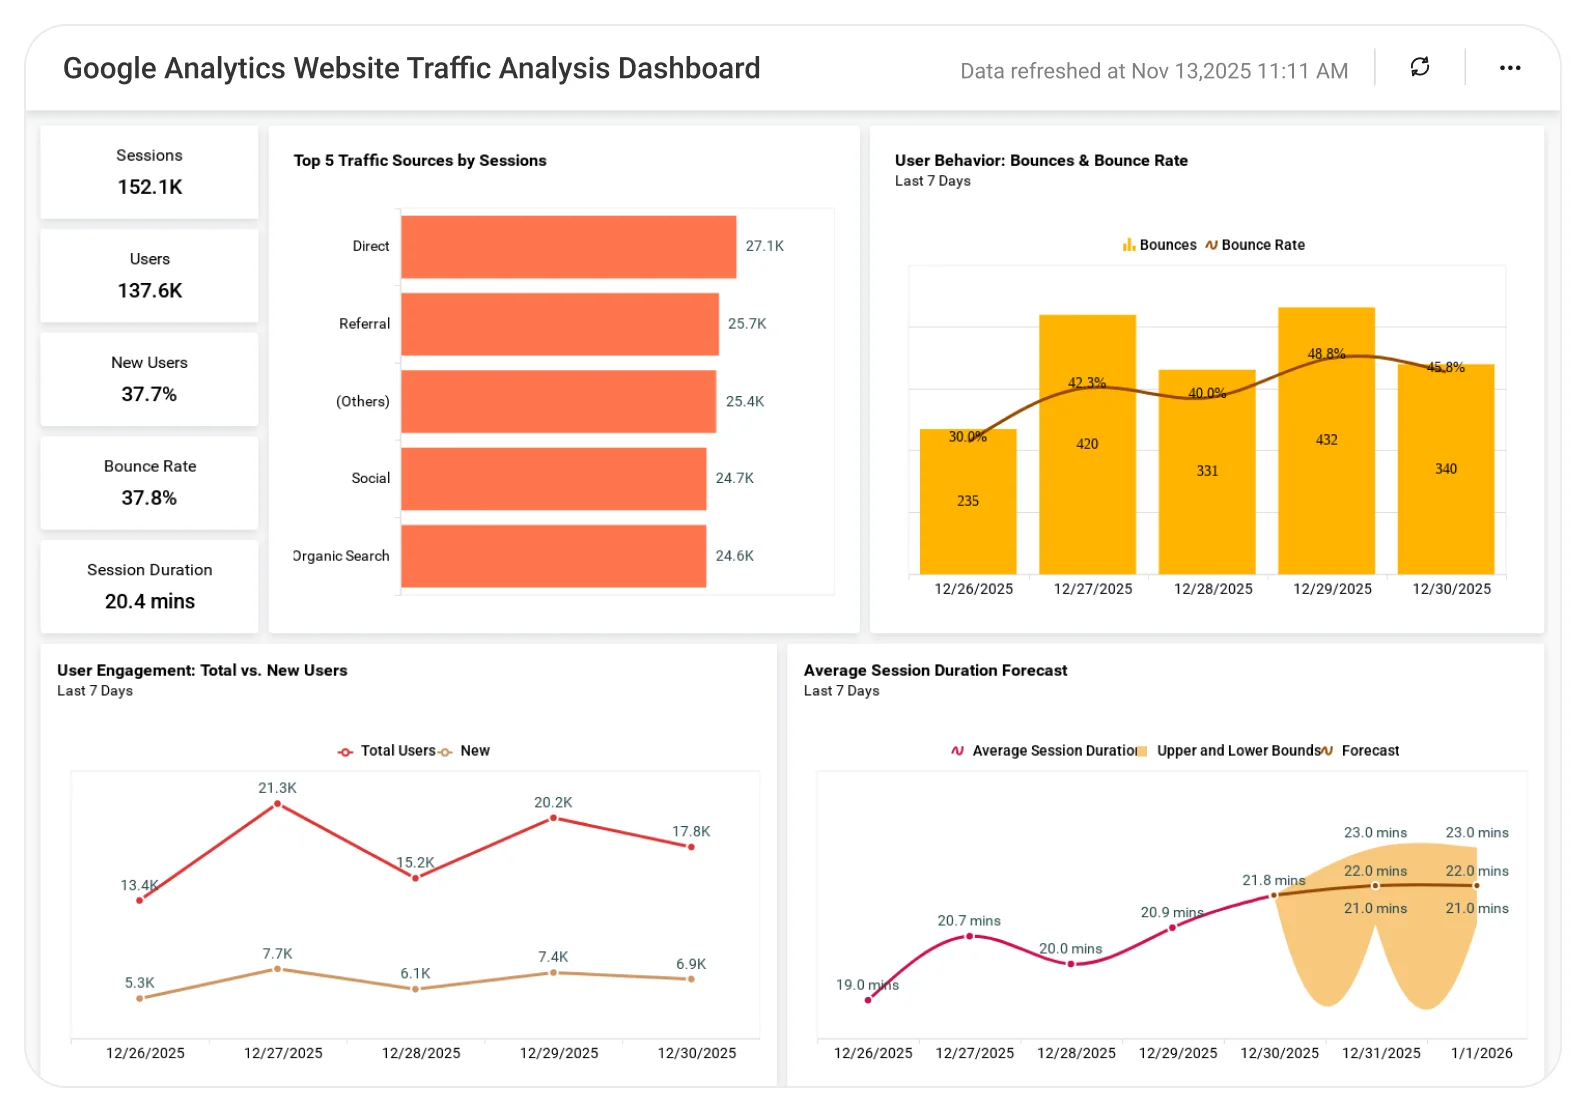
The Google Analytics Website Traffic Dashboard helps teams analyze visitor behavior, traffic sources, page performance, and user journeys, enabling better content decisions, improved user experience, and higher conversion outcomes.
TL;DR
-
Audience & Behavior Insights: Total users, new vs. returning users, average session duration, bounce rate.
-
Acquisition Performance: Traffic by channel (organic, social, email, referral, paid), landing page performance.
-
Engagement Quality: Session trends, high-drop-off pages, location-based engagement levels.
-
Executive View: Marketing funnel trends, regional performance, campaign-attribution insights.
-
Interactive Analysis: Filter by date range, channel, device, country, or campaign.
What Is a Website Traffic Dashboard?
A Website Traffic Dashboard is a real-time, data-driven view of your website visitors, acquisition channels, engagement patterns, and geographic reach.
In Bold BI, that means unified visualizations showing user count cards, session KPIs, bounce-rate gauges, geo-distribution maps, traffic-source charts, session-duration trends, and forecast models, all powered by connected marketing data.
Marketing teams can instantly understand what’s working, what’s not, and where to optimize next.
Why Website Traffic Dashboard Matters
Understanding website traffic is essential to knowing whether your marketing efforts are attracting the right audience and driving meaningful engagement. Clear visibility into traffic sources, user behavior, and trends helps teams move beyond vanity metrics and focus on what actually impacts growth.
With accurate website traffic insights, marketing teams can:
-
Identify which channels bring high-quality visitors.
-
Detect drops or spikes in traffic early and respond quickly.
-
Improve content and landing pages based on real user behavior
-
Align marketing performance with business and conversion goals.
This ensures decisions are based on data, not assumptions, and that traffic growth translates into real outcomes.
What You’ll Track
-
Audience volume & behavior: Real-time users, new vs. returning visitors, session counts, and engagement patterns.
-
Acquisition channels & traffic mix: Organic, paid, social, email, referral, and direct traffic performance.
-
Engagement & quality metrics: Bounce rate, session duration, page depth, and landing page effectiveness.
-
Geographic & device insights: User distribution by country, region, and device type.
-
Trend & Campaign Impact Analysis: Weekly session trends highlighting seasonality, campaigns, and traffic spikes.
All dashboards are fully customizable so you can add metrics like conversion rate, scroll depth, campaign attribution, UTM performance, or funnel progression as needed.
How It Works
-
Connect your data sources using Google analytics, Ads, Adsense, Drive, Google Sheets.
-
Apply the Website Traffic Dashboard sample.
-
Blend acquisition, engagement, and marketing performance data.
-
Share role-specific perspectives with marketing teams, leadership, or content owners.
-
Create alerts for bounce-rate spikes, drops in sessions, or sudden channel surges.
Why Bold BI Is the Right Fit for Google Analytics Website Traffic Analytics
When traffic data lies inside Google Analytics, CRM, Ads platforms, and spreadsheets, decision-making slows and insights get lost.
By merging all your marketing metrics, Bold BI enables teams to respond to questions like:
-
Are we attracting the right audience to our site?
-
Which channels bring the most engaged visitors?
-
How does user behavior vary across regions or campaigns?
-
Where are we losing users and how can we improve engagement?
-
Which marketing investments actually drive meaningful traffic?
Bold BI provides a centralized, real-time view for CMOs, growth teams, analysts, and content owners.
Compare Options (at a glance)
| Feature | Bold BI | Google Analytics (GA4) Reports | Spreadsheets / Manual Reporting |
|---|---|---|---|
| Traffic & acquisition trends (users, sessions, channels) | Yes | Yes | Manual |
| Engagement & behavior (pages, events, time, scroll) | Yes | Yes (often needs exploration) | Manual |
| Conversion tracking & funnel analysis | Yes | Partial (depends on setup) | Manual |
| Audience segmentation (geo, device, new vs returning) | Yes | Yes | Manual |
| Custom KPIs & dashboards | Fully customizable | Limited/custom | Manual |
Frequently Asked Questions
More Articles About Google Analytics Website Traffic
-
Track Your Website Conversions and Sources in One Place
 Learn how to monitor conversions and traffic sources in a single dashboard for better marketing decisions.
-
Track Website Conversions and Revenue Together
Shows how combining conversion and revenue data helps optimize campaigns and boost ROI.
-
10 Best Marketing Dashboards to Grow Your Business
Highlights top dashboards for tracking KPIs, improving engagement, and driving business growth.
-
Monitor & Increase Website Traffic Using Embedded Analytics
Explains how embedded analytics provides real-time traffic insights to enhance site performance.


