
Release Management Dashboard
Understand release planning and progress to deliver software updates with confidence.
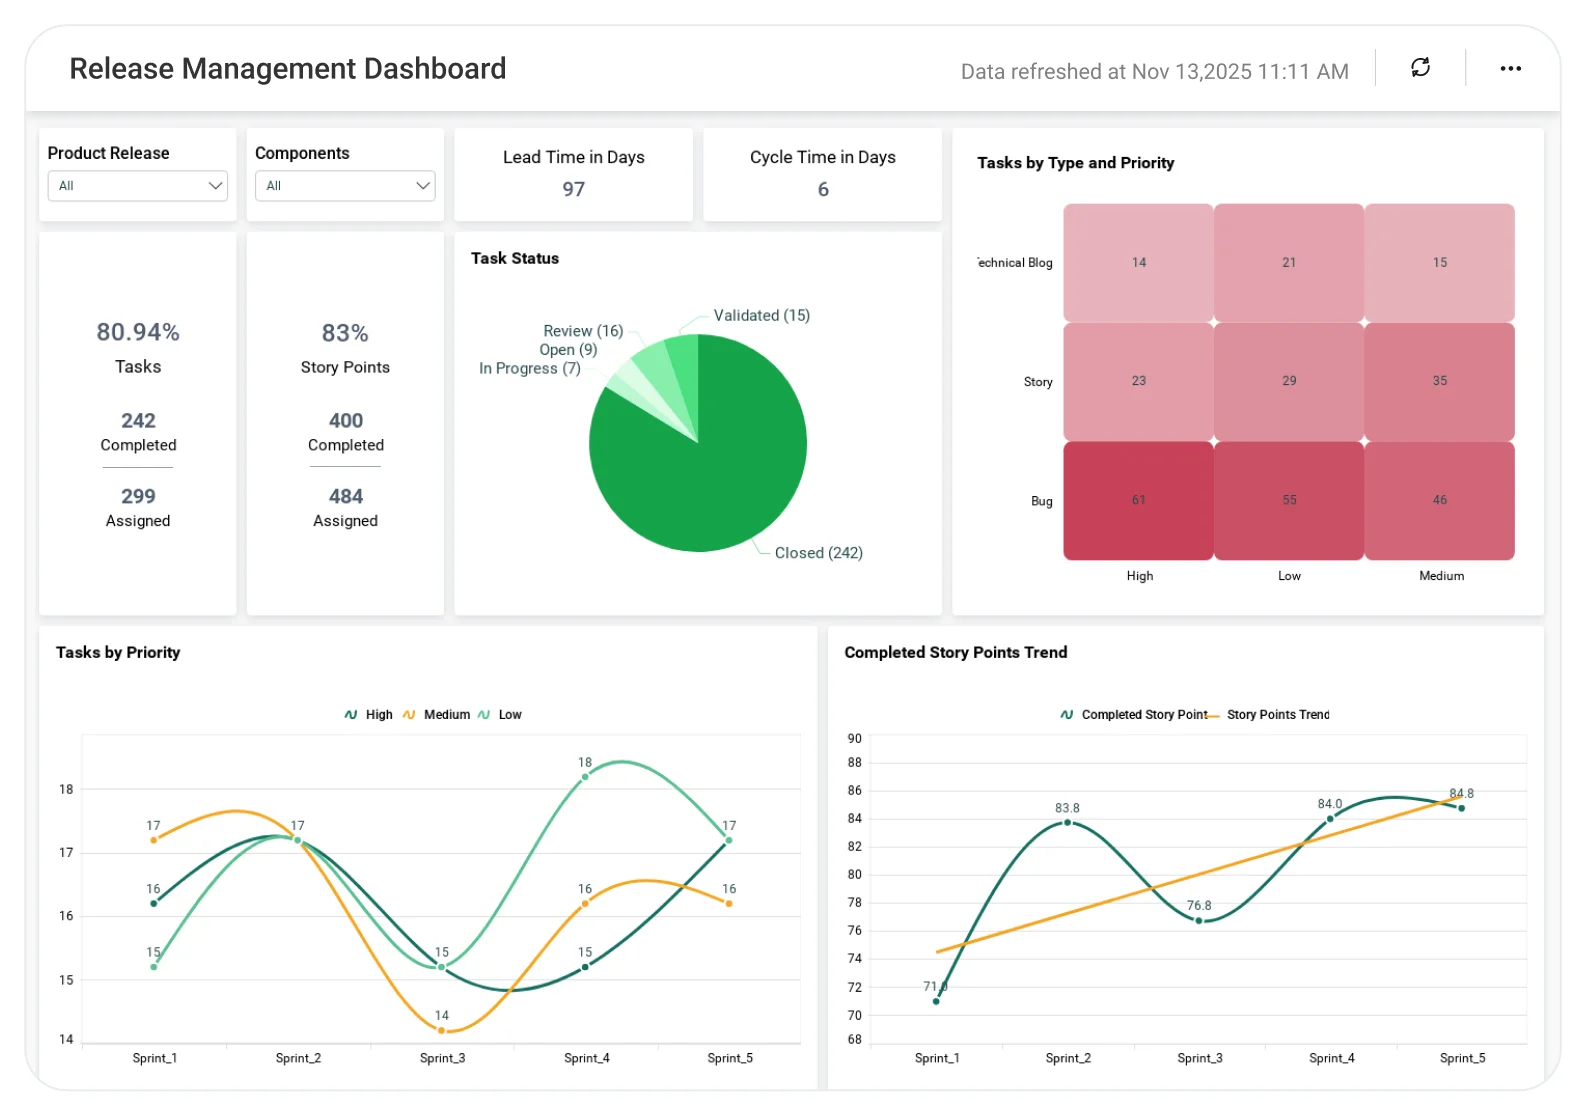
The Release Management Dashboard helps agile teams analyze release schedules, scope readiness, risks, and delivery timelines, enabling better coordination, reduced release risks, and more predictable software releases.
TL;DR
-
Track the number of completed tasks, stories, and sprints.
-
Planned vs. completed story points.
-
Task breakdown by type and priority.
-
Release status distribution.
-
Component-wise delivery insights.
What Is a Release Management Dashboard?
A Release Management Dashboard is a visual analytics solution that helps Agile teams monitor release progress, task status, and delivery performance across products and components.
In Bold BI, it becomes an interactive dashboard with KPIs, charts ,grids and filters automatically updated from project management data sources.
Why Release Management Dashboard Matters
Agile teams need continuous visibility into progress, priorities, and release readiness.
Without a centralized release dashboard:
-
Release risks are identified too late.
-
Task priorities are hard to balance.
-
Delivery performance is difficult to measure.
Bold BI consolidates release metrics into one dashboard, so teams can track execution, identify bottlenecks, and improve delivery predictability.
What You’ll Track
-
Release progress overview: Project start and rollout dates, total hours worked, and completed tasks, stories, and sprints.
-
Story point delivery: Planned versus completed story points, broken down by component.
-
Task distribution: Tasks grouped by type and priority to understand workload allocation.
-
Release status tracking: Percentage of tasks in different statuses such as open, in progress, and completed.
-
Component-level insights: Delivery performance and story point completion by product component.
All dashboards are fully customizable, so you can add KPIs or metrics as needed.
How It Works
-
Select the Release Management Dashboard sample.
-
Blend tasks, stories, sprints, story points, and release data in one view.
-
Share role-based dashboards with product owners, engineering leads, and managers.
-
Track release progress, identify bottlenecks, and improve delivery planning.
Why Bold BI Is the Right Fit for Release Management Analytics
-
Centralize release reporting: Combines tasks, stories, sprints, and release metrics in one view.
-
Support delivery analysis: Enables comparison of planned vs. completed work across components.
-
Enable focused drilldowns: Move quickly from release-level metrics to component- or priority-specific insights.
-
Built for Agile workflows: Support release planning, reviews, and retrospectives with purpose-built dashboards.
-
Deploy flexibly: Supports cloud and self-hosted environments for engineering teams.
Compare Options (at a glance)
| Feature | Bold BI Release Management Dashboard | Agile Tool Reports | Spreadsheets |
| Task, story & sprint tracking | Yes | Limited | Manual |
| Story point delivery analysis | Yes | Limited | Manual |
| Priority-based task insights | Yes | Limited | Manual |
| Release status visibility | Yes | Limited | Manual |
| Executive-ready Agile dashboards | Yes | Limited | No |
Frequently Asked Questions
More Articles About Agile Release & Delivery Analytics
-
Manage and Enhance a Successful Agile Release Using Embedded Analytics
 Explains how embedded analytics helps Agile teams plan releases more effectively by tracking sprint progress, story point delivery, risks, and release readiness in real time.


