
Customer Satisfaction Dashboard for Project Managers
Understand customer feedback to improve product quality and user satisfaction.
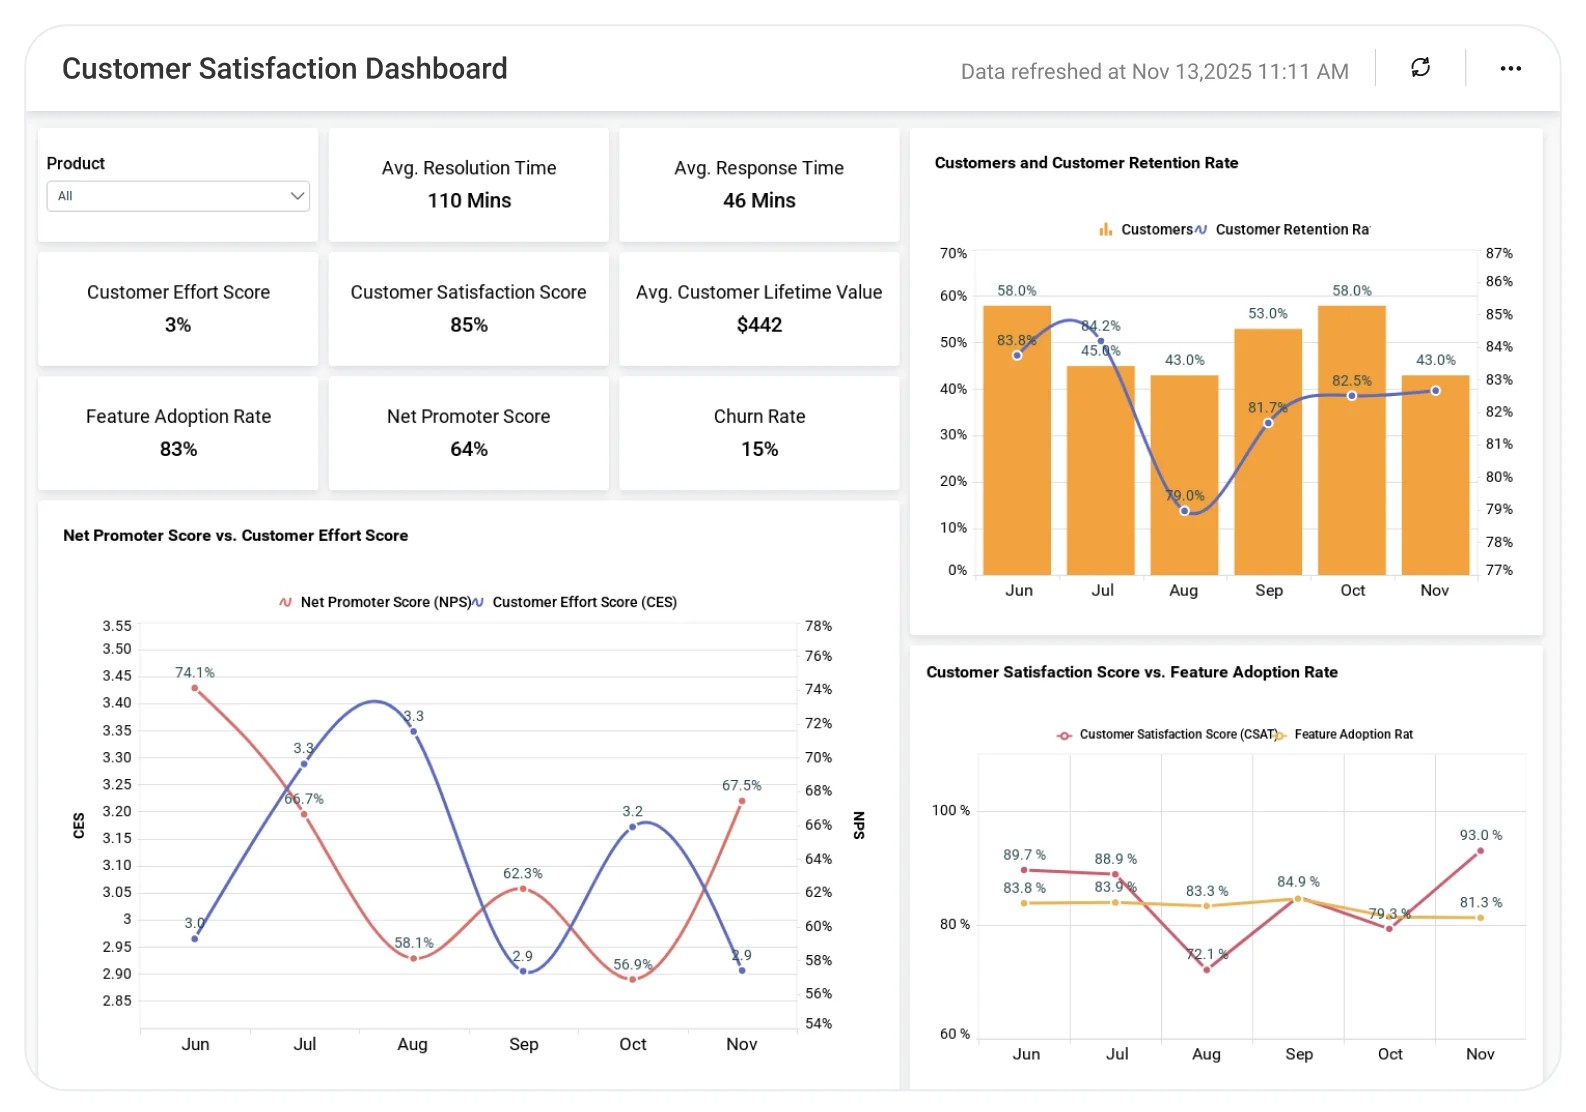
The Customer Satisfaction Dashboard helps teams analyze feedback scores, sentiment trends, and customer issues, enabling data-driven improvements that strengthen customer trust and loyalty.
TL;DR
-
Customer sentiment tracking: Real-time CSAT and NPS across projects or releases.
-
Feedback-to-action loop: Link customer scores to specific project phases or outputs.
-
Issue impact insights: Identify bugs, features, or delays that affect satisfaction most.
-
Retention indicators: Monitor churn risk and repeat engagement.
-
Executive summary: Satisfaction trends across teams, projects, or regions.
What Is a Customer Satisfaction Dashboard?
A customer satisfaction dashboard gives project managers a real-time view of how customers feel about project outcomes. It helps you identify delivery gaps, align internal teams with client expectations, and improve satisfaction after every release.
In Bold BI, interactive dashboards bring survey data, support tickets, and delivery metrics together in one place.
Why Customer Satisfaction Dashboard Matters
Project success is no longer measured only by delivery timelines; it’s also defined by customer experience. Without clear visibility into how projects impact customer satisfaction, teams struggle to identify issues early and respond effectively.
By connecting project delivery metrics with customer feedback and support data, teams can detect risks sooner, improve outcomes, and ensure projects deliver real value to customers.
What You’ll Track
Using Bold BI dashboards, you will track important KPIs such as:
-
Customer Satisfaction (CSAT): Average satisfaction scores calculated by project, product, or team.
-
Net Promoter Score (NPS): Visualize customer loyalty and advocacy trends over time.
-
Retention & Churn: Identify recurring engagement patterns and post-delivery drop-offs.
-
Ticket resolution impact: Understand how resolution speed and quality affect customer satisfaction.
-
Feedback breakdown: Identify what drives high scores and the root causes behind low ratings.
-
Project Performance vs. Satisfaction: Correlate project delivery KPIs and customer ratings.
All dashboards are fully customizable. Add KPIs like SLA compliance, feature usage, or lead time to link customer experience with delivery performance.
How It Works
-
Use the Customer Satisfaction sample: Visualize metrics already prepared for CSAT, NPS, and feedback trends.
-
Mix project data: Connecting delivery metrics, release outcomes, and support responses.
-
Share dashboards: Give project-level views for managers, executives, and delivery teams.
-
Be proactive: Set alerts for decreasing customer satisfaction or issues that keep occurring.
Why Is Bold BI the Right Fit for Customer Satisfaction Analytics
Connect project delivery metrics directly to customer outcomes.
-
Unified project & customer insights: Bring project delivery metrics, customer satisfaction, and support data into one dashboard.
-
Portfolio-to-detail drilldowns: Navigate from portfolio-wide satisfaction trends down to individual projects, tickets, or customers.
-
Actionable customer feedback: Track satisfaction trends across active and completed projects and respond quickly to negative signals.
-
Secure, governed analytics: Ensure controlled access with Row Level Security(RLS), Single Sign On(SSO), Role Based Access Control(RBAC), and audit logs.
Compare Options (at a glance)
| Feature | Bold BI | CRM / Survey Tool Reports | Spreadsheets |
|---|---|---|---|
| Customer satisfaction analytics (CSAT/NPS) | Yes | Limited | Manual |
| Sentiment & feedback trend tracking | Yes | Partial | Manual |
| Project, customer & region drilldowns | Yes | Limited | Manual |
| SLA, issue resolution & escalation visibility | Yes | Limited | Manual |
| Custom KPIs & dashboards | Fully customizable | Fixed | Manual |
Frequently Asked Questions
More Articles About Customer Satisfaction Dashboard
-
Harnessing the Power of BI for Customer Segmentation & Personalization
 This blog shows how BI helps segment customers and personalize experiences, improving satisfaction and loyalty.
-
Mastering Customer Retention through BI Analytics
This blog explains how BI analytics identifies churn risks and retention drivers to keep customers engaged.
-
Customer-Facing Analytics: What It Is, Benefits & Use Cases
This blog covers how customer-facing analytics builds transparency and trust, enhancing overall satisfaction.


