
Defect Management Dashboard for Product & Quality Leads
Understand defect patterns and priorities to improve software quality and release stability.
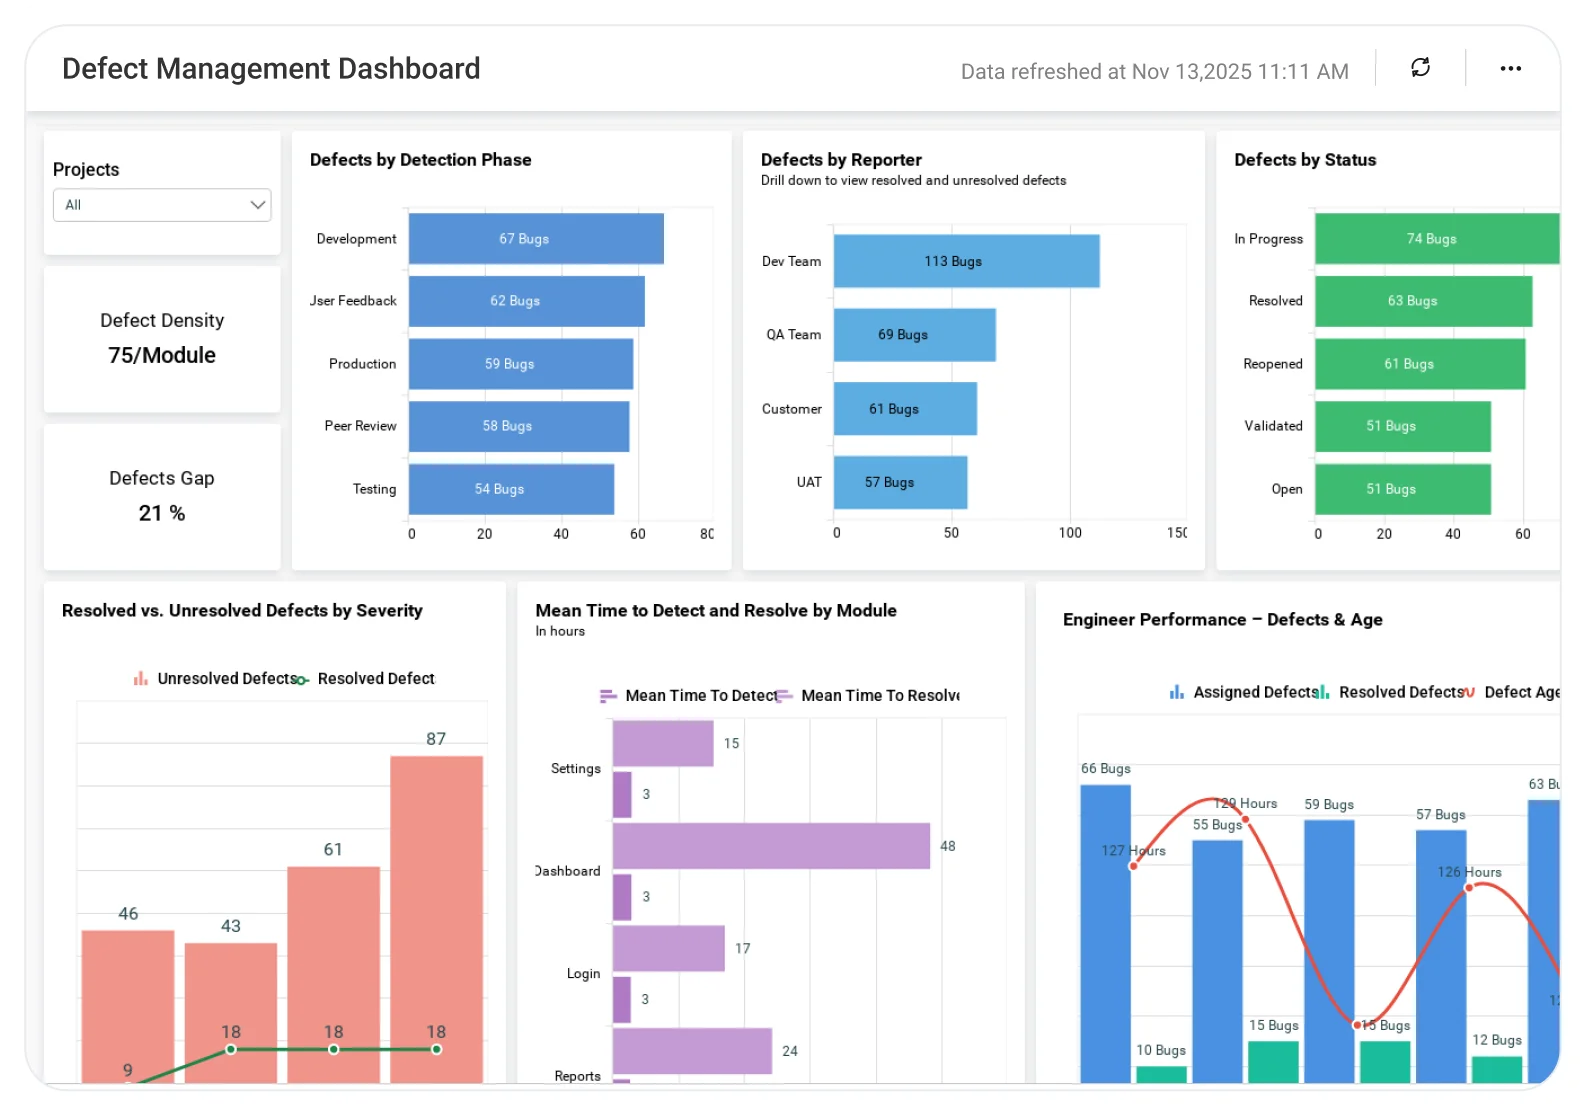
The Defect Management Dashboard helps teams analyze defect severity, status, root causes, and resolution trends, enabling faster fixes, reduced rework, and more reliable software releases.
TL;DR
-
Track defect health across open, closed, and reopened issues by severity.
-
Identify ownership gaps across modules, releases, and teams.
-
Monitor quality trends including MTTR, defect density, and escaped defects.
-
Connect quality to outcomes by linking defects to releases and customer impact.
-
Act faster with alerts for critical regressions and defect spikes.
What Is a Defect Management Dashboard?
A Defect Management Dashboard is a real-time command center for product quality. It visualizes each defect’s lifecycle, from detection to resolution so teams can spot risks, reduce backlog aging, and improve customer satisfaction.
In Bold BI, this means interactive dashboards that pull together Agile, QA, and release data into a single, connected view.
Why Defect Management Dashboard Matters
Untracked or poorly managed defects slow releases, increase rework, and impact product quality. Without clear visibility into defect trends, priorities, and ownership, teams struggle to fix the right issues at the right time.
Effective defect management helps teams identify critical defects early, balance workloads, and improve release quality so engineering and QA teams can deliver reliable products with confidence.
What You’ll Track
Using Bold BI dashboards, you will track important KPIs such as:
-
Defect trends: Fluctuations of open, closed, and reopened defects in one continuous timeline.
-
Severity breakdown: Critical, high, medium, and low defect proportions.
-
Resolution efficiency: Average MTTR; defects resolved for each dev per sprint.
-
Module health: Defect occurrences per module/component and per release.
-
Escaped defects: Breaking issues found by customers after-release and defect leakage rate.
-
Defect ageing: Duration in open status, bottleneck analysis per assignee or the whole team.
All dashboards are fully customizable, so you can add KPIs or metrics as needed.
How It Works
-
Apply the sample of defect management: Ready-made KPIs for defect density, MTTR, and severity.
-
Merge with business data: Link the defect trends to the release outcomes or the customer support tickets.
-
Share dashboards: Role-based views for QA team, product manager and execs.
-
Stay well-informed: Real-time notifications for defect spikes or ageing of critical issues can be set.
Why Bold BI Is the Right Fit for Defect Management Analytics
-
Unified QA + product analytics: A BI platform that merges QA, product, and engineering metrics.
-
Cross-tool visibility: Analyze defects across Jira, GitHub, Azure DevOps, and test suites.
-
Self-service dashboards: Empower QA leads, PMs, and execs with role-based analytics.
-
Flexible deployment: Choose cloud or self-hosted to meet compliance needs.
-
Embedded insights: Embed dashboards directly into Jira, internal portals, or customer systems.
Compare Options (at a glance)
| Feature | Bold BI | QA / ALM Tool Reports | Spreadsheets |
|---|---|---|---|
| Defect analytics by severity, module & release | Yes | Limited | Manual |
| Defect aging, SLA breach & resolution time tracking | Yes | Partial | Manual |
| Root-cause & trend drilldowns (build → sprint → component) | Yes | Limited | Manual |
| QA execution & leakage visibility (test runs vs. defects) | Yes | Limited | Manual |
| Custom KPIs & dashboards | Fully customizable | Fixed | Manual |
Frequently Asked Questions
More Articles About Defect Management
-
Improve Defect Management in Agile Using Embedded Analytics
 Blog post detailing benefits of embedding defect dashboards, tracking defect trends, and improving product quality.
-
7 Metrics for Quality Control and Defect Analysis
This blog discusses KPIs like defect density, MTTR, and predictive analytics for proactive prevention.


