
Survey Monkey Survey Overview Dashboard
Gain a clear overview of survey results to understand audience opinions and trends.
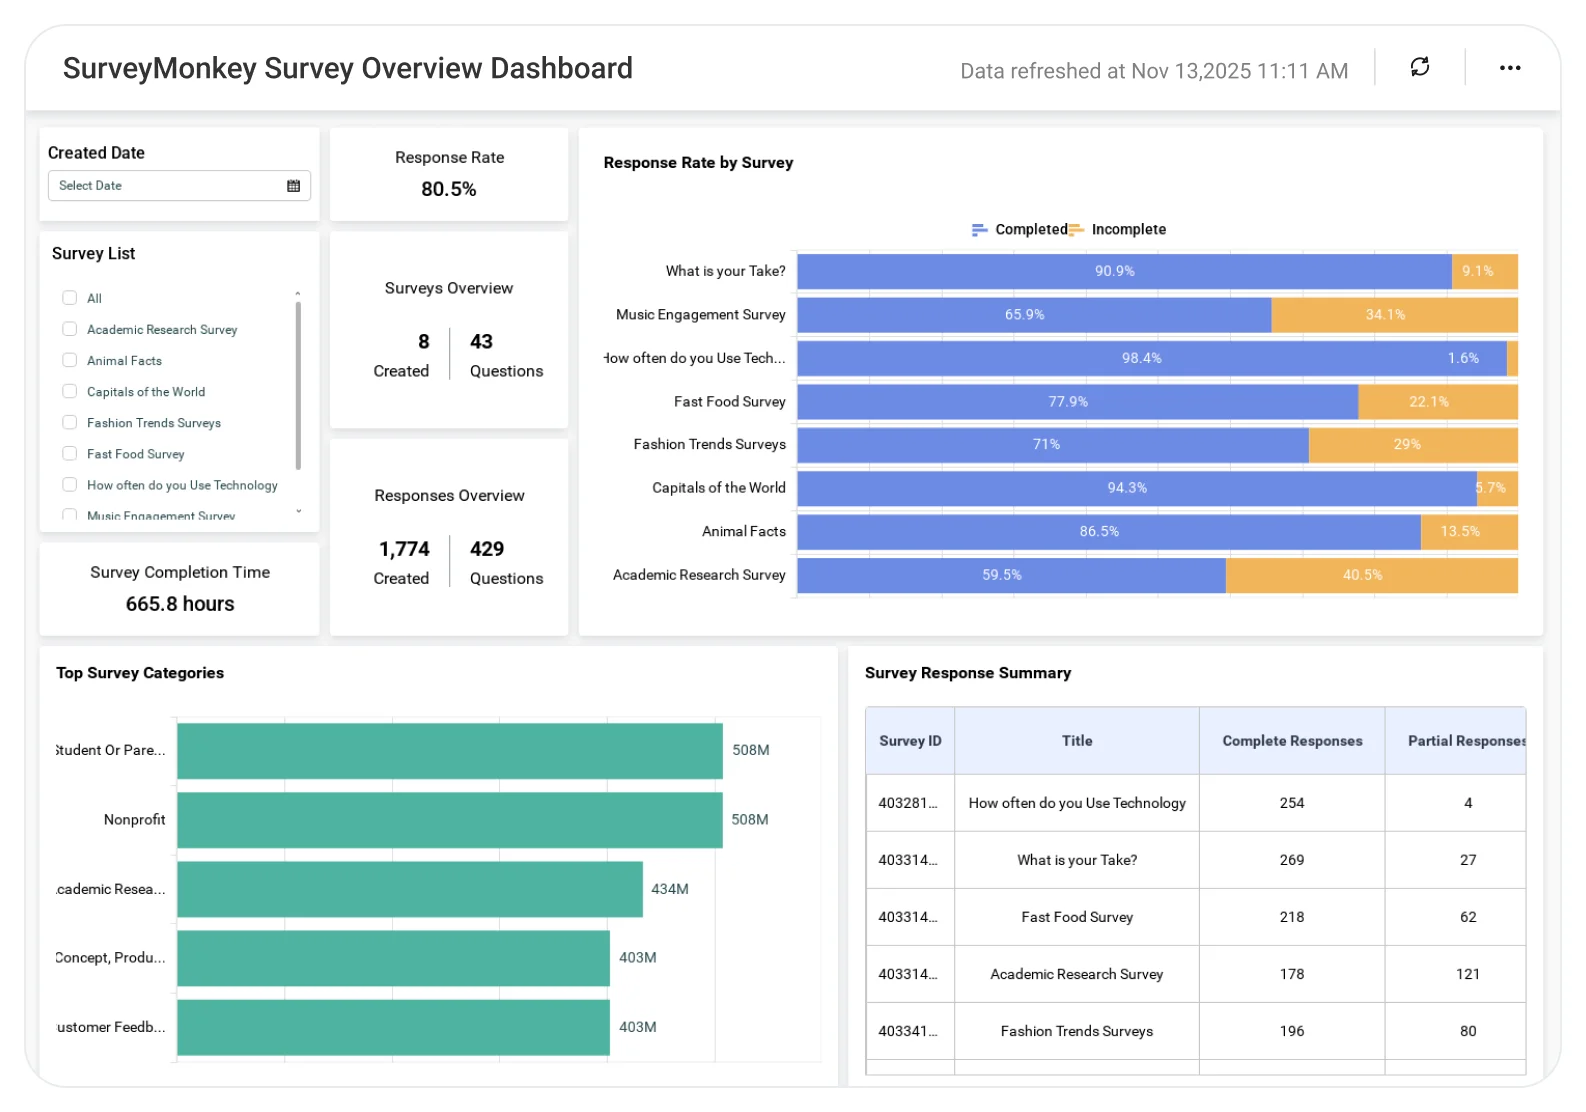
The SurveyMonkey Survey Overview Dashboard helps teams analyze response volume, completion rates, and key feedback metrics, enabling faster insights and more confident decision-making.
TL;DR
-
Category performance: Identify which survey categories attract the most engagement.
-
Response analysis: Measure response rates, question volume, and completion time.
-
Trend tracking: Track weekly and monthly participation trends.
-
Survey drill-down: Drill down into individual survey performance using the summary grid.
What Is a SurveyMonkey Survey Overview Dashboard?
The SurveyMonkey dashboard is designed to analyze survey performance, including completion rates, response trends, and participation metrics, so teams can improve survey design and outcomes.
In Bold BI, that means combining raw survey data with advanced visualizations, so leaders can quickly spot trends, improve survey design, and make data-driven decisions.
Why SurveyMonkey Survey Overview Dashboard Matters
Survey data is valuable only when it’s easy to interpret and act on. When responses are spread across individual surveys or static reports, teams struggle to understand participation, engagement, and overall sentiment trends.
A SurveyMonkey Survey Overview Dashboard brings survey activity, response behavior, and completion patterns into one clear view. This helps teams quickly identify which surveys are performing well, where engagement drops, and how audiences interact with surveys, enabling better decisions in HR, marketing, customer experience, and research initiatives.
What You'll Track
-
Survey volume & structure: Monitor total surveys created and total questions to understand survey scale and complexity.
-
Response & completion status: Track completed vs. partially completed surveys to measure engagement quality.
-
Participation by category: Analyze response activity by survey category, department, or theme.
-
Top-performing surveys: Identify the most engaging surveys using response count rankings.
-
Completion time insights: Measure average time spent completing surveys to assess survey length and usability.
-
Detailed survey overview: Review survey titles, question counts, total responses, and completion percentages in a single summary grid.
How It Works
-
Connect: Link your SurveyMonkey API to Bold BI.
-
Apply sample: Start with the SurveyMonkey Survey Overview Dashboard.
-
Blend: Merge survey data with business or operational metrics.
-
Share: Enable secure, role-based permissions for controlled dashboard access.
-
Monitor: Set alerts to catch participation drops or low response rates early.
Why Bold BI Is the Right Fit for SurveyMonkey Analytics
-
Beyond native SurveyMonkey reports: Blend SurveyMonkey data with HR, CRM, or business KPIs for deeper context.
-
Interactive drilldowns: Move from high-level survey metrics to detailed response insights effortlessly.
-
Secure & governed sharing: Share dashboards safely using Row Level Security(RLS), Single Sign On(SSO), and Role Based Access Control(RBAC).
-
Embedded analytics: Embed survey dashboards into internal portals, dashboards, or web applications.
-
Flexible deployment: Deploy Bold BI in the cloud or self-hosted environments to match your infrastructure and compliance needs.
Compare Options (at a glance)
| Feature | Bold BI | SurveyMonkey Analytics | Spreadsheets / Manual Reporting |
|---|---|---|---|
| Response volume & trend tracking (responses over time) | Yes | Yes | Manual |
| Question-level breakdowns (single/multi-select, matrix) | Yes | Yes | Manual |
| Segmentation (by audience, collector, demographics, custom tags) | Yes | Limited | Manual |
| Cross-tab & correlation-style views | Yes | Limited | Manual |
| Text response analysis (themes, keywords via integrations) | Yes | Partial | Manual |
| Custom KPIs & dashboards | Fully customizable | Limited to built-in | Manual |


