
Business Survey Analysis Dashboard
Turn survey responses into actionable insights to improve business decisions.
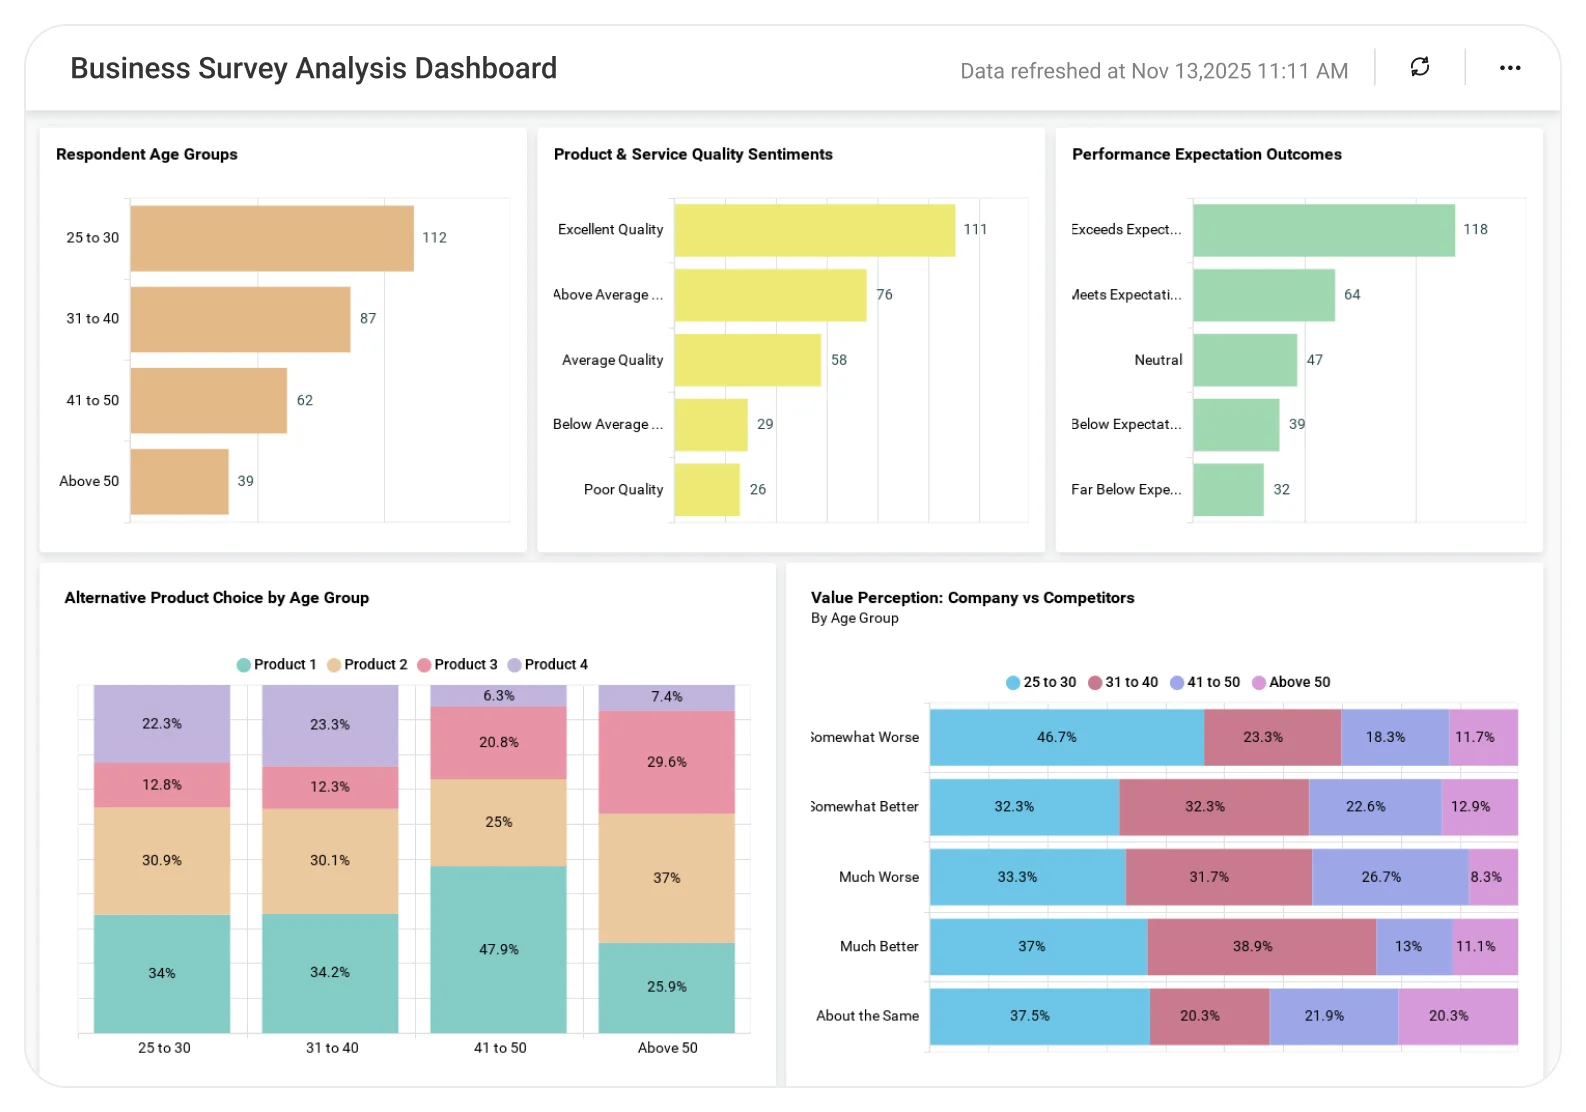
The Business Survey Analysis Dashboard helps teams analyze survey responses, satisfaction scores, and feedback trends, enabling organizations to understand opinions, identify improvement areas, and take data-driven actions.
TL;DR
-
Customer insight visualization: Check satisfaction, loyalty, and product usage at a glance.Customer Insight Visualization: Check satisfaction, loyalty, and product usage at a glance.
-
Demographics analysis: Identify customer age groups and professional fields for better targeting.
-
Support performance: Measure how effectively your team resolves issues.
-
Brand preference: Find out which competitor brands customers might choose.
-
Retention trends: Track how long customers stick with your products.
What Is a Business Survey Analysis Dashboard?
A Business Survey Analysis Dashboard is a BI tool that visualizes customer opinions, satisfaction levels, and product usage, helping teams understand feedback at scale and track trends over time.
With Bold BI, you can combine survey responses with demographic and product data to understand loyalty, service quality, and brand perception, all in one interactive dashboard.
Why Business Survey Analysis Dashboard Matters
Customer feedback is valuable only when it leads to action. When survey responses are buried in spreadsheets or disconnected reports, teams struggle to understand satisfaction, loyalty, and retention risks in time.
A Business Survey Analysis Dashboard turns raw survey data into clear, visual insights, helping leaders understand how customers feel, how support impacts satisfaction, and what influences repeat purchases. This visibility enables faster improvements in service quality, product strategy, and long-term customer loyalty.
What You'll Track
-
Support Experience Bar Chart: Measure how effectively your team resolves customer issues.
-
Customer Satisfaction Pie Chart: Visualize satisfaction levels and identify areas for improvement.
-
Repeat Purchase Likelihood Pie Chart: Gauge the probability of customers buying again.
-
Customer Retention Bar Chart: Track loyalty by analyzing product usage duration.
-
Product Preference Donut Chart: Discover which competitor brands customers choose.
These visuals help you understand who your customers are, how they feel, and what keeps them coming back.
How It Works
-
Connect: Import data from SurveyMonkey, SurveyGizmo, Excel, and SQL databases.
-
Apply Sample: Select the Business Survey Analysis Dashboard.
-
Blend: Merge feedback with customer or sales metrics.
-
Share: Give secure access to management and teams.
-
Act: Use insights to improve strategy.
Why Bold BI Is the Right Fit for business Survey Analytics
Go beyond survey results and connect feedback to real business outcomes.
-
Bold BI gives decision-makers an end-to-end view of customer sentiment from first impressions to long-term loyalty, so teams can identify issues early and take action with confidence.
-
Blend survey data with CRM, product usage, or marketing data for deeper insights.
-
Identify satisfaction drivers and churn risks early to detect patterns that signal loyalty or dissatisfaction before revenue is impacted.
-
Deploy securely on the cloud or on-premises to meet security and compliance needs.
-
Embed dashboards directly into portals, SaaS apps, or internal systems.
Compare Options (at a glance)
| Feature | Bold BI | Survey Platform Built-in Analytics | Spreadsheets |
|---|---|---|---|
| Business survey response trends | Yes | Limited | Manual |
| Segment & demographic breakdowns | Yes | Limited | Manual |
| Cross-tab & correlation analysis | Yes | Limited | Manual |
| Open-text feedback analysis (tagging/integrations) | Yes | Partial | Manual |
| Custom KPIs & dashboards | Fully customizable | Fixed | Manual |
Frequently Asked Questions
More Articles About Business Survey Analysis Dashboard
-
Benefits of Embedded Analytics in Business Survey
 This blog explains how embedding survey dashboards improves marketing, customer experience, decision-making, and product quality.
-
6 Ways Dashboards Boost Research & Data Collection
This blog highlights dashboards’ role in tracking survey engagement, team performance, and data accuracy.


