
Supply Chain Inventory Management Dashboard
Optimize warehouse operations by improving inventory flow, accuracy, and order fulfillment.
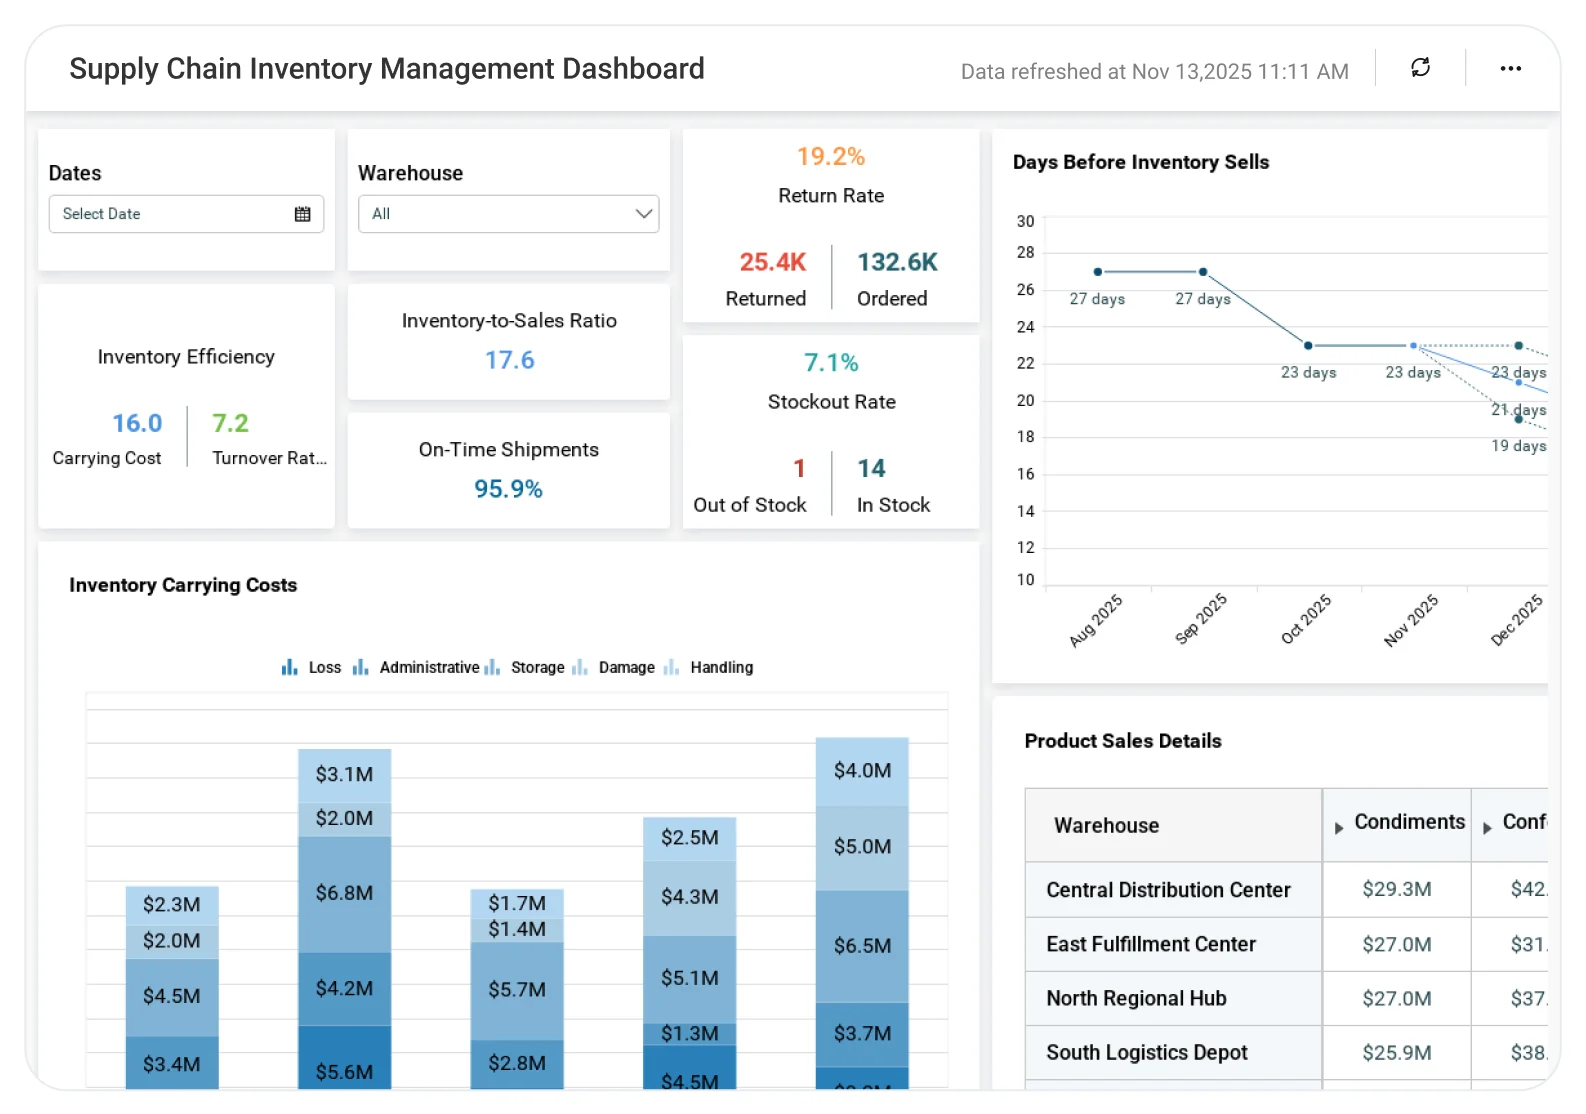
The Warehouse Management Dashboard helps supply chain teams analyze stock movement, order processing, and space utilization, enabling faster fulfillment, reduced errors, and lower operational costs.
TL;DR
-
Stock performance tracking: Out-of-stock percentages, backorder rates, and product availability.
-
Operational efficiency: Inventory turnover, inventory-to-sales ratio, and days of supply.
-
Cost insights: Inventory carrying costs and product return rates.
-
Product details: Warehouse-level stock counts, ordered units, and returns.
-
Data filtering: Analyze performance by warehouse and time period.
What is a Supply Chain Warehouse Management Dashboard?
A Warehouse Management Dashboard provides an analytical view of key inventory metrics to measure performance and operational efficiency across warehouses.
With Bold BI, combine warehouse inventory data with advanced visual analytics. This identifies stock shortages, analyzes carrying costs, and streamlines fulfilment processes.
Why Supply Chain Warehouse Inventory Management Dashboard Matters
Warehouse operations directly impact customer satisfaction, cash flow, and supply chain efficiency. When inventory data is scattered across spreadsheets and systems, teams struggle to detect stock shortages, excess inventory, or rising holding costs in time.
A Supply Chain Warehouse Inventory Management Dashboard brings stock availability, fulfillment performance, and cost metrics into one real-time view. This helps supply chain teams reduce stockouts and backorders, control inventory carrying costs, improve turnover, and make informed replenishment decisions, ensuring the right products are in the right warehouses at the right time.
What You’ll Track
Using Bold BI dashboards, you will track important KPIs such as:
-
Availability and fulfilment: Back-order rates and out-of-stock percentages to see how well demand is being met.
-
Product stock overview: Units in warehouse, units ordered, and items available for sale across categories and locations.
-
Return patterns: Return rates that highlight quality issues or customer dissatisfaction.
-
Inventory cost insights: Carrying-cost breakdowns to spot costly warehousing practices.
-
Inventory efficiency: Turnover, inventory-to-sales ratio, and days of supply to measure overall performance.
-
Time-based analysis & filtering: Filter data by warehouse and date range to review specific facilities, analyze seasonal patterns, or focus on short time windows (daily, weekly, monthly).
All dashboards can be customizable so you can add KPIs, adjust thresholds, or blend data from sales, logistics, and warehouse systems.
How It Works
-
Apply Warehouse Management sample Dashboard.
-
Blend stock, order, and cost data.
-
Securely share your dashboards with CFOs, controllers, and department leads.
-
Set data alerts for overspending, missed targets, or significant variance spikes.
Why Bold BI Is the Right Fit for Supply Chain Inventory Management
Bold BI gives warehouse and supply chain teams clear visibility into inventory operations across locations. It helps cut down on stock discrepancies and boosts overall warehouse efficiency.
-
Seamless data integration: Integrate inventory data from Excel, SQL databases, SharePoint and order management systems.
-
Instant warehouse benchmarking: Benchmark the health of your stock by looking at warehouses. Check by category or even by specific SKU.
-
Secure access: Bold BI uses Row Level Security(RLS), Single Sign-On(SSO), Role-Based Access Control(RBAC), and token authentication for secure access.
-
Flexible deployment of the dashboards in cloud or self-hosted.
-
Effortless embedded analytics: Embed the dashboards right into your warehouse portal. Put them directly in supply chain applications too.
Compare Options (at a glance)
| Feature | Bold BI | ERP/WMS Inventory Reports | Spreadsheets / Manual Reporting |
|---|---|---|---|
| Stock on hand & inventory valuation (by item/location) | Yes | Yes | Manual |
| Demand vs supply trends & forecasting signals | Yes | Limited | Manual |
| Reorder planning (ROP, safety stock, stockout risk) | Yes | Partial | Manual |
| Inventory turnover, aging & slow/obsolete stock | Yes | Yes | Manual |
| Multi-warehouse visibility & transfer tracking | Yes | Yes | Manual |
| Custom KPIs & dashboards | Fully customizable | Limited to built-in | Manual |
Frequently Asked Questions
More Articles About Supply Chain Inventory Management Dashboard
-
Role of Business Intelligence in Supply Chain Management
 This blog explains how BI tools enhance supply chain visibility, improve agility, and optimize inventory for cost savings and better decisions.
-
Manage Your Supply Chain Warehouse Efficiently with Embedded Analytics
This blog helps you learn how embedded analytics improves warehouse operations, reduces risk, and ensures proper inventory management for efficiency.


