
Customer Shipping Performance Insights Dashboard
Improve delivery reliability, reduce shipping delays, and strengthen customer satisfaction through data-driven shipping insights.
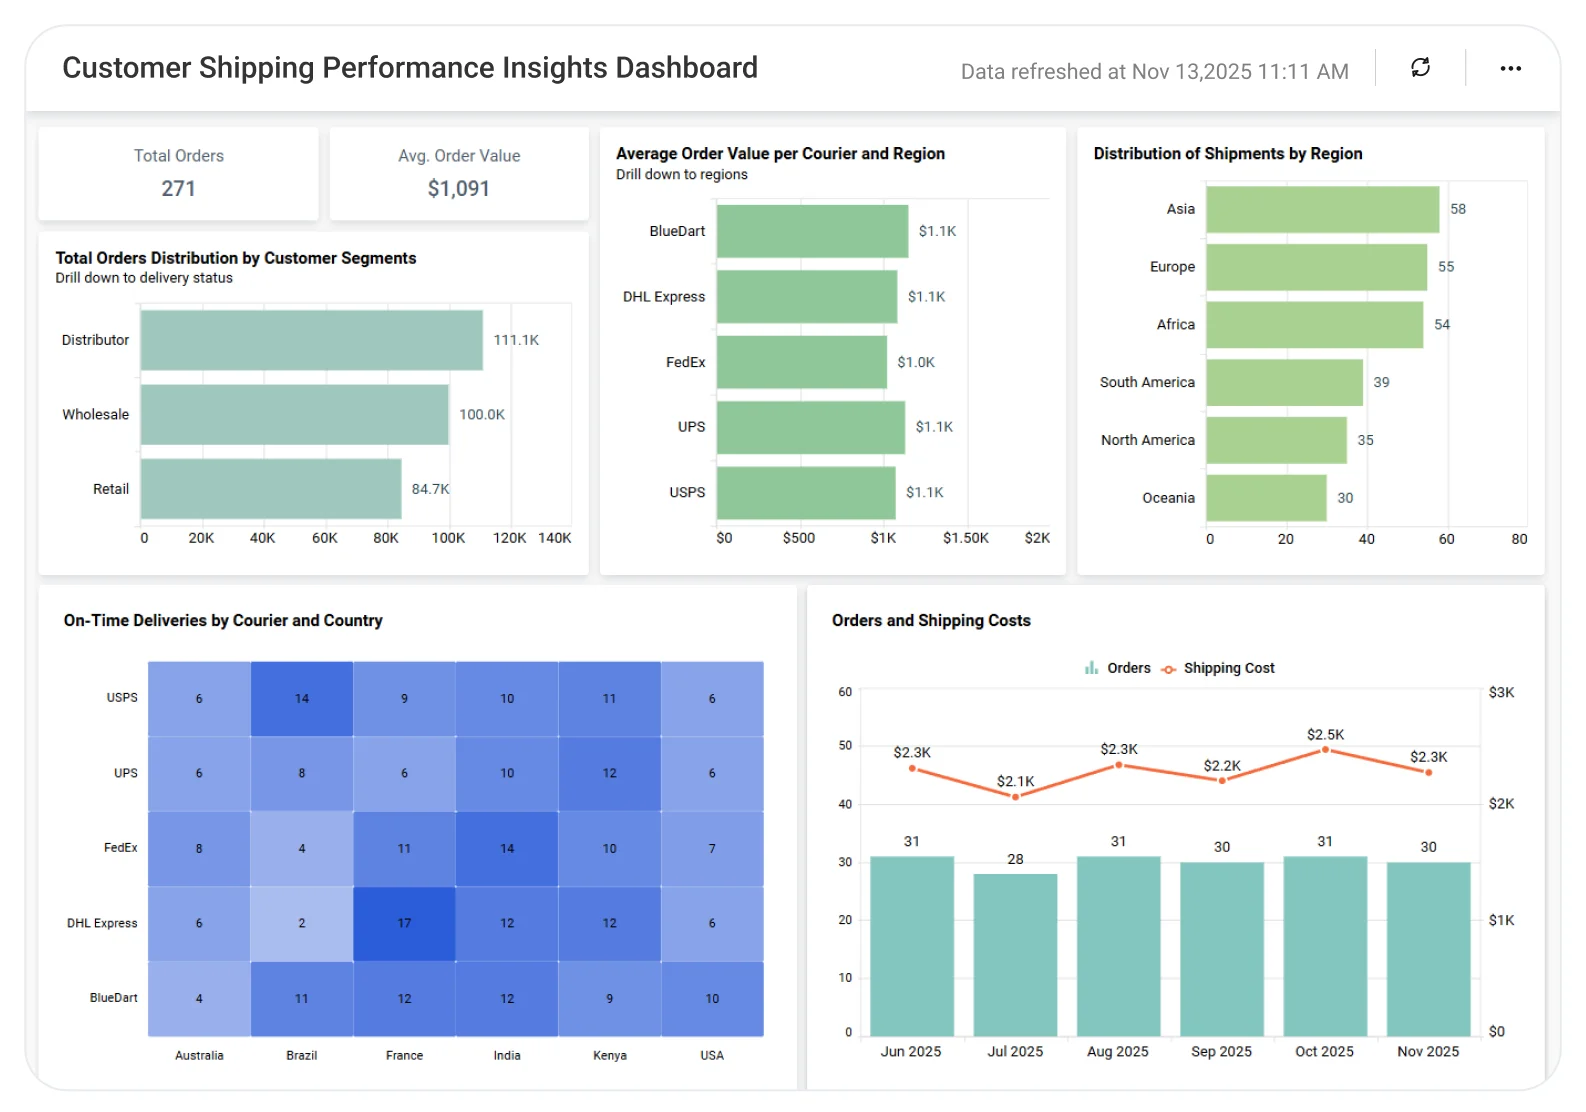
The Customer Shipping Performance Insights Dashboard helps logistics, operations, and customer experience teams track shipment timelines, delivery performance, and SLA outcomes in one centralized view supporting faster issue resolution and more consistent customer deliveries.
TL;DR
-
Track shipping volume, delivery status, and performance trends in one unified dashboard.
-
Monitor on-time vs delayed shipments to quickly identify service reliability issues.
-
Compare shipping performance by customer and region to uncover recurring service gaps.
-
Analyze delay patterns and SLA compliance to improve fulfillment decisions.
-
Improve delivery reliability and customer satisfaction with data-driven shipping insights.
What Is an Customer Shipping Performance Insights Dashboard?
A Customer Shipping Performance Insights Dashboard is an analytics solution that helps teams understand how effectively customer shipments are fulfilled across orders, regions, and timeframes.
In Bold BI, this dashboard connects with OData-based shipping and order systems to consolidate delivery timelines, statuses, and customer data, supporting informed decisions around logistics performance and customer service improvements.
Why Customer Shipping Performance Insights Dashboard Matters
Shipping performance directly impacts customer trust, retention, and operational cost.
When shipping data is reviewed through fragmented systems:
-
Delivery issues surface too late.
-
Underperforming routes or customers are hard to identify.
-
SLA compliance lacks visibility.
-
Customer complaints increase without clear root causes.
A centralized analytics dashboard enables teams to move from reactive delivery tracking to proactive, insight-driven shipping performance management.
What You’ll Track
Using Bold BI dashboards, you will track important KPIs such as:
-
On-time delivery rate: Percentage of shipments delivered within promised timelines to assess service reliability.
-
Shipment status distribution: Breakdown of delivered, delayed, and in-transit shipments to understand fulfillment flow.
-
Customer-wise shipping performance: Delivery success and delay rates by customer to identify service gaps.
-
Regional delivery trends: Shipping performance across regions or locations to uncover geographic bottlenecks.
All dashboards are fully customizable so you can add KPIs or metrics as needed.
How It Works
-
Connect Odata-based shipping, order, and customer systems to Bold BI.
-
Apply the Customer Shipping Performance Insights Dashboard sample.
-
Combine shipment, delivery, and customer data in one unified view.
-
Analyze insights by customer, region, status, or time period.
-
Share dashboards with logistics, operations, and customer success teams.
Why Bold BI Is the Right Fit for Customer Shipping Performance Analytics
-
Unified shipping visibility: Bring shipment status, timelines, and customer data into a single analytics dashboard.
-
Centralized performance analysis: Evaluate delivery reliability and delays together.
-
Comparative insights: Compare customers, regions, or periods to identify performance gaps.
-
Actionable drilldowns: Investigate delayed shipments, SLA misses, or customer-specific issues in detail.
-
Flexible deployment: Deploy dashboards in cloud or self-hosted environments to align with logistics workflows.
Compare Options (at a glance)
| Feature | Bold BI | Logistics System Reports | Spreadsheets |
| Customer shipping analytics | Yes | Limited | Manual |
| On-time delivery insights | Yes | Partial | Manual |
| Customer & regional comparison | Yes | Limited | Manual |
| Delay trend analysis | Yes | Limited | No |
| Custom KPIs & drilldowns | Fully customizable | Fixed | Manual |


