
Real Estate Analysis Dashboard
Analyze occupancy, revenue, expenses, and portfolio performance to support confident real estate investment decisions.
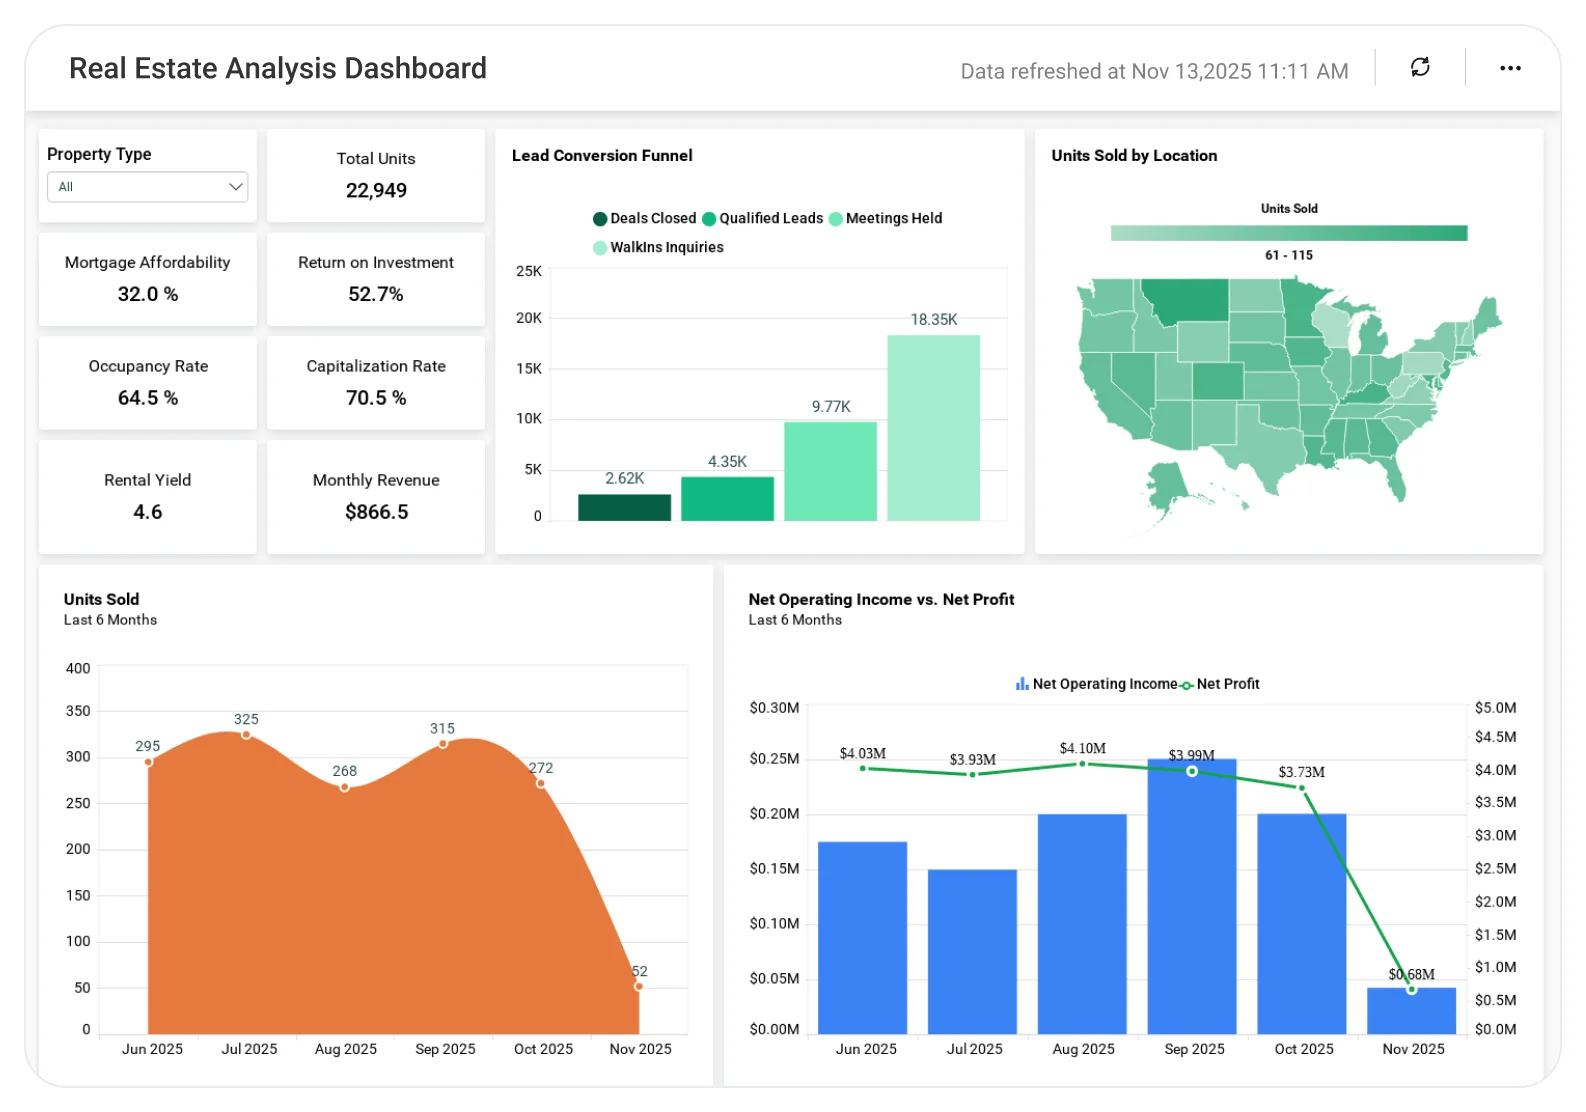
The Real Estate Analysis Dashboard helps property managers, investors, and real estate leaders track property performance, occupancy, and revenue trends in one consolidated view, enabling smarter acquisition, leasing, and asset optimization decisions.
TL;DR
-
Track portfolio-level performance and revenue trends to understand overall asset health.
-
Monitor occupancy, vacancy, and lease status to identify revenue risks early.
-
Analyze property-wise income and expense breakdowns to evaluate profitability.
-
Compare performance across locations and asset types to spot high- and low-performing properties.
-
Support smarter investment, leasing, and asset optimization decisions with data-driven real estate insights.
What Is a Real Estate Analysis Dashboard?
A Real Estate Analysis Dashboard is an analytics solution that consolidates operational, financial, and portfolio data to show how properties are performing across locations and asset types.
With Bold BI, data from property management systems, leasing tools, accounting platforms, and spreadsheets is unified into interactive dashboards, helping teams move from static reports to actionable real estate intelligence.
Why Real Estate Analysis Dashboard Matters
Real estate decisions involve long-term financial commitments and operational complexity.
When data is fragmented across tools:
-
Underperforming properties are identified too late.
-
Vacancies and revenue risks remain hidden.
-
Portfolio decisions rely on intuition instead of data.
-
Financial reviews require manual consolidation.
A centralized real estate dashboard enables teams to move from reactive reporting to proactive portfolio management.
What You’ll Track
Using Bold BI dashboards, you will track important KPIs such as:
-
Occupancy & vacancy rates: Current and historical occupancy trends to assess property utilization.
-
Rental income & revenue trends: Income performance by property, location, or asset type.
-
Expense & profitability insights: Operating costs and net performance to evaluate asset efficiency.
-
Property & location performance: Compare regions and property categories to identify underperforming assets.
All dashboards are customizable, allowing you to add KPIs such as churn prediction, maintenance of SLA, lease renewal probability, or per‑unit profitability as needed.
How It Works
From data connection to live dashboards in hours, not weeks.
-
Apply the Real Estate Analysis Dashboard sample.
-
Combine financial, leasing, and operational data into a unified model.
-
Analyze insights by property, region, asset type, or time period.
-
Share dashboards with asset managers, finance teams, and leadership.
Why Bold BI Is the Right Fit for Real Estate Portfolio Analytics
-
Delivers clear visibility into portfolio performance: Helps teams quickly identify high-performing and underperforming properties.
-
Supports smarter leasing and investment decisions: Uses historical and trend data to guide pricing, renewals, and acquisitions.
-
Reduces manual financial and operational reporting: Replaces spreadsheets and static reports with interactive dashboards.
-
Enables location and asset-type comparisons: Makes it easy to compare performance across regions and property categories.
-
Scales across growing real estate portfolios: Designed for organizations managing multiple properties and locations.
Compare Options (at a glance)
| Feature | Bold BI | Property Reports | Spreadsheets |
| Portfolio-level analytics | Yes | Limited | Manual |
| Occupancy & revenue insights | Yes | Partial | Manual |
| Property & location comparisons | Yes | Limited | Manual |
| Trend & profitability analysis | Yes | Limited | Manual |
| Custom KPIs & dashboards | Fully customizable | Fixed | Manual |
Frequently Asked Questions
More Articles About Real Estate Analysis
-
How AppFolio Users Can Benefit from Embedded Analytics
 Learn how AppFolio users who are basically property managers leverage embedded BI for smarter property insights and better control.


