
Property Management Dashboard
Gain clear visibility into property performance to improve operational efficiency and profitability.
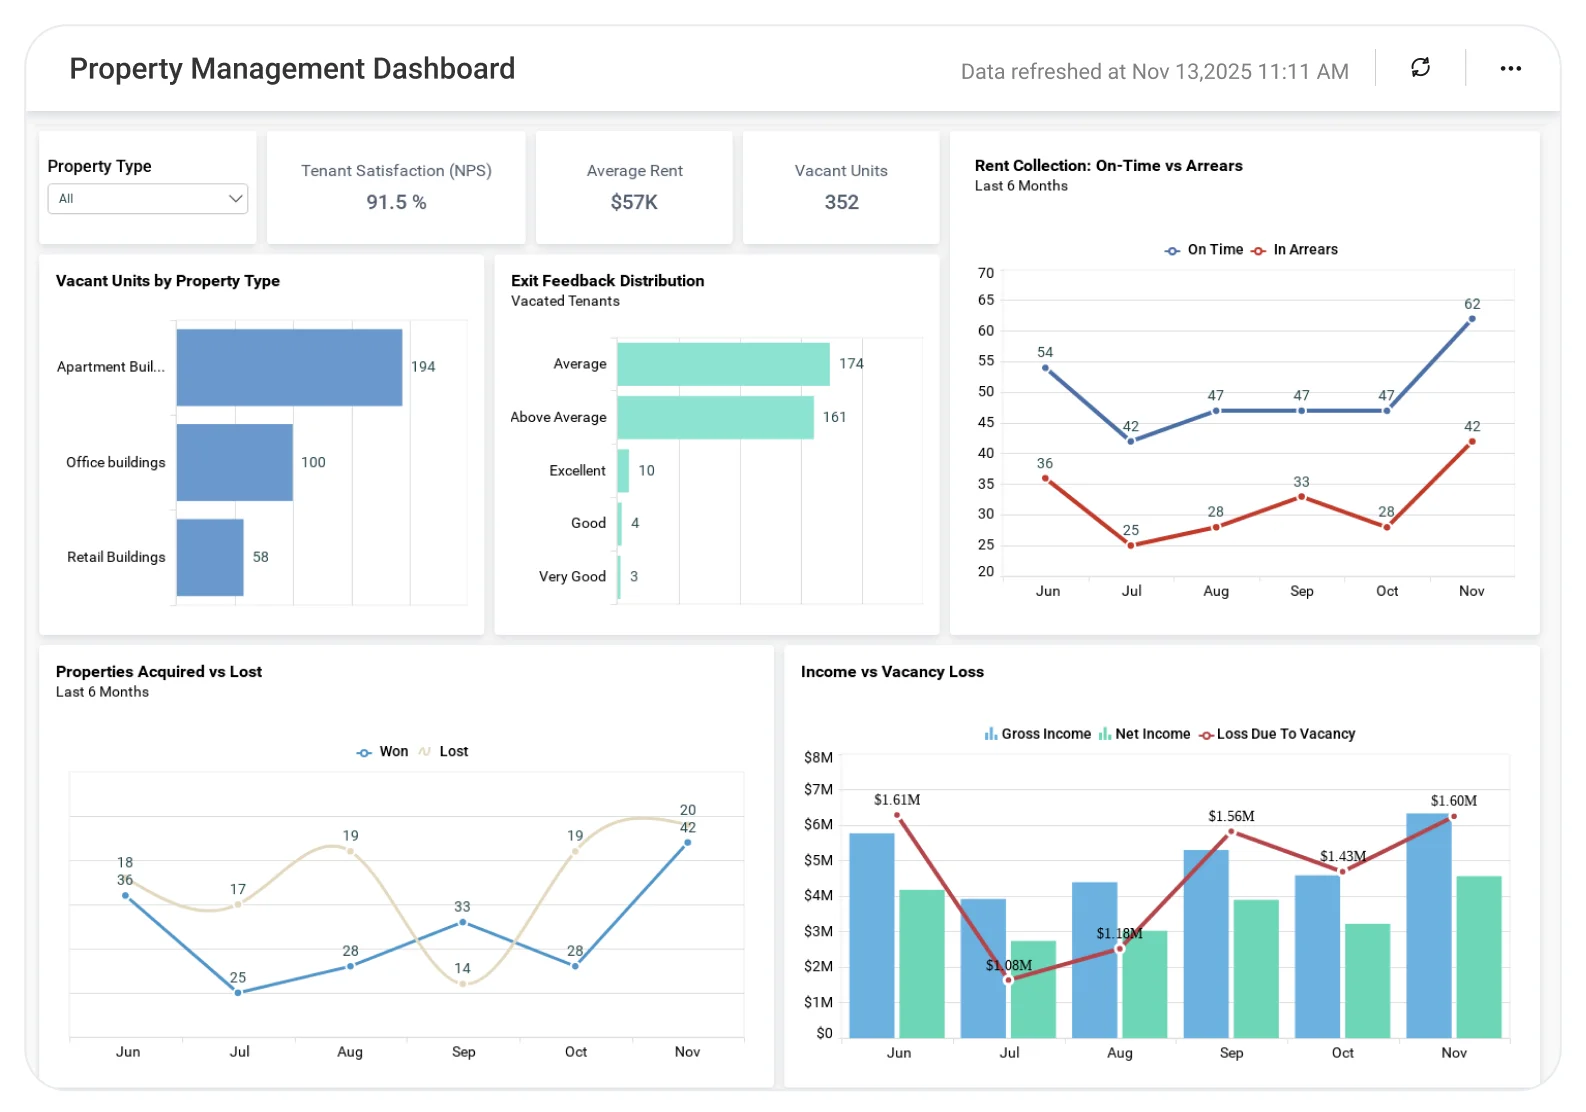
The Property Management Dashboard helps teams analyze occupancy rates, rental income, maintenance activities, and property-wise performance, enabling better planning, cost control, and informed property management decisions.
TL;DR
-
Portfolio overview: Total properties, units, occupancy rate, and vacancy.
-
Rental income tracking: Rent collected vs. expected, overdue payments, and revenue trends.
-
Maintenance visibility: Open requests, resolution time, and cost by property.
-
Tenant insights: Lease status, renewals, move-ins, and move-outs.
-
Executive snapshot: High-level KPIs for owners and leadership.
What Is a Property Management Dashboard?
A Property Management Dashboard is an interactive analytics view that tracks property performance, occupancy, rental income, maintenance activity, and tenant lifecycle metrics.
In Bold BI, this means real-time visuals, drilldowns by property or unit, trend analysis, and alerts, powered by live data from your property and finance systems.
Why Property Management Dashboard Matters
Property data often lives across accounting tools, property management systems, spreadsheets, and maintenance logs. That fragmentation makes it hard to answer basic questions quickly.
Bold BI helps you clearly answer:
-
Which properties are underperforming?
-
Are vacancies increasing or stabilizing?
-
How much rental income is at risk?
-
Where are maintenance costs rising?
-
Which tenants are due for renewal?
What You’ll Track
-
Occupancy & vacancy trends: Track occupied units, vacancy rates, and changes over time.
-
Rental income performance: Monitor rent billed vs. collected, overdue amounts, and revenue trends.
-
Maintenance & repair activity: Analyze open requests, resolution time, and maintenance costs by property.
-
Tenant & lease lifecycle: Track lease renewals, expirations, move-ins, and move-outs.
All dashboards are customizable so you can add KPIs like churn prediction, maintenance of SLA, lease renewal probability, or per-unit profitability as needed.
How It Works
From data connection to live dashboards in hours, not weeks.
-
Apply the Property Management sample with ready-to-use KPIs.
-
Blend financial + operational + tenant data to reveal performance drivers.
-
Share your dashboard securely among your managers, executives, and owners.
-
Set proactive alerts for high vacancy, rising maintenance costs, or arrears increase.
Why Bold BI Is the Right Fit for Property Management Analytics
-
One system for financials, occupancy, tenant sentiment, and maintenance costs.
-
Portfolio-to-unit drill-downs in a single click.
-
Governed analytics with Single Sign On, Role Based Access Control, and Row Level Security.
-
Simple embedding dashboards into POS or internal portals.
-
Automated updates with no manual data merges or weekly reporting cycles.
Compare Options (at a glance)
| Feature | Bold BI | Property Management System (PMS) Reports | Spreadsheets / Manual Reporting |
|---|---|---|---|
| Occupancy & vacancy trends (by property/unit/type) | Yes | Yes (often standard) | Manual |
| Rent roll & revenue performance (collected vs billed, AR) | Yes | Yes (varies by PMS) | Manual |
| Maintenance & work order tracking (open/closed, SLA, cost) | Yes | Limited (varies by PMS) | Manual |
| Tenant insights (leases, renewals, delinquency))** | Yes Yes | Yes (basic) | Manual |
| Custom KPIs & dashboards | Fully customizable | Limited to built-in | Manual |
Frequently Asked Questions
More Articles About Property Management Dashboard
-
Improve Your Property Management Business with Embedded Analytics
 blog explores how embedded analytics enhances efficiency and decision-making in property management.
-
How AppFolio Users Can Benefit from Embedded Analytics
Learn how AppFolio users who are basically property managers leverage embedded BI for smarter property insights and better control.


