
Motor Vehicle Accidents Analysis Dashboard
Understand road accident patterns to improve public safety and traffic planning.
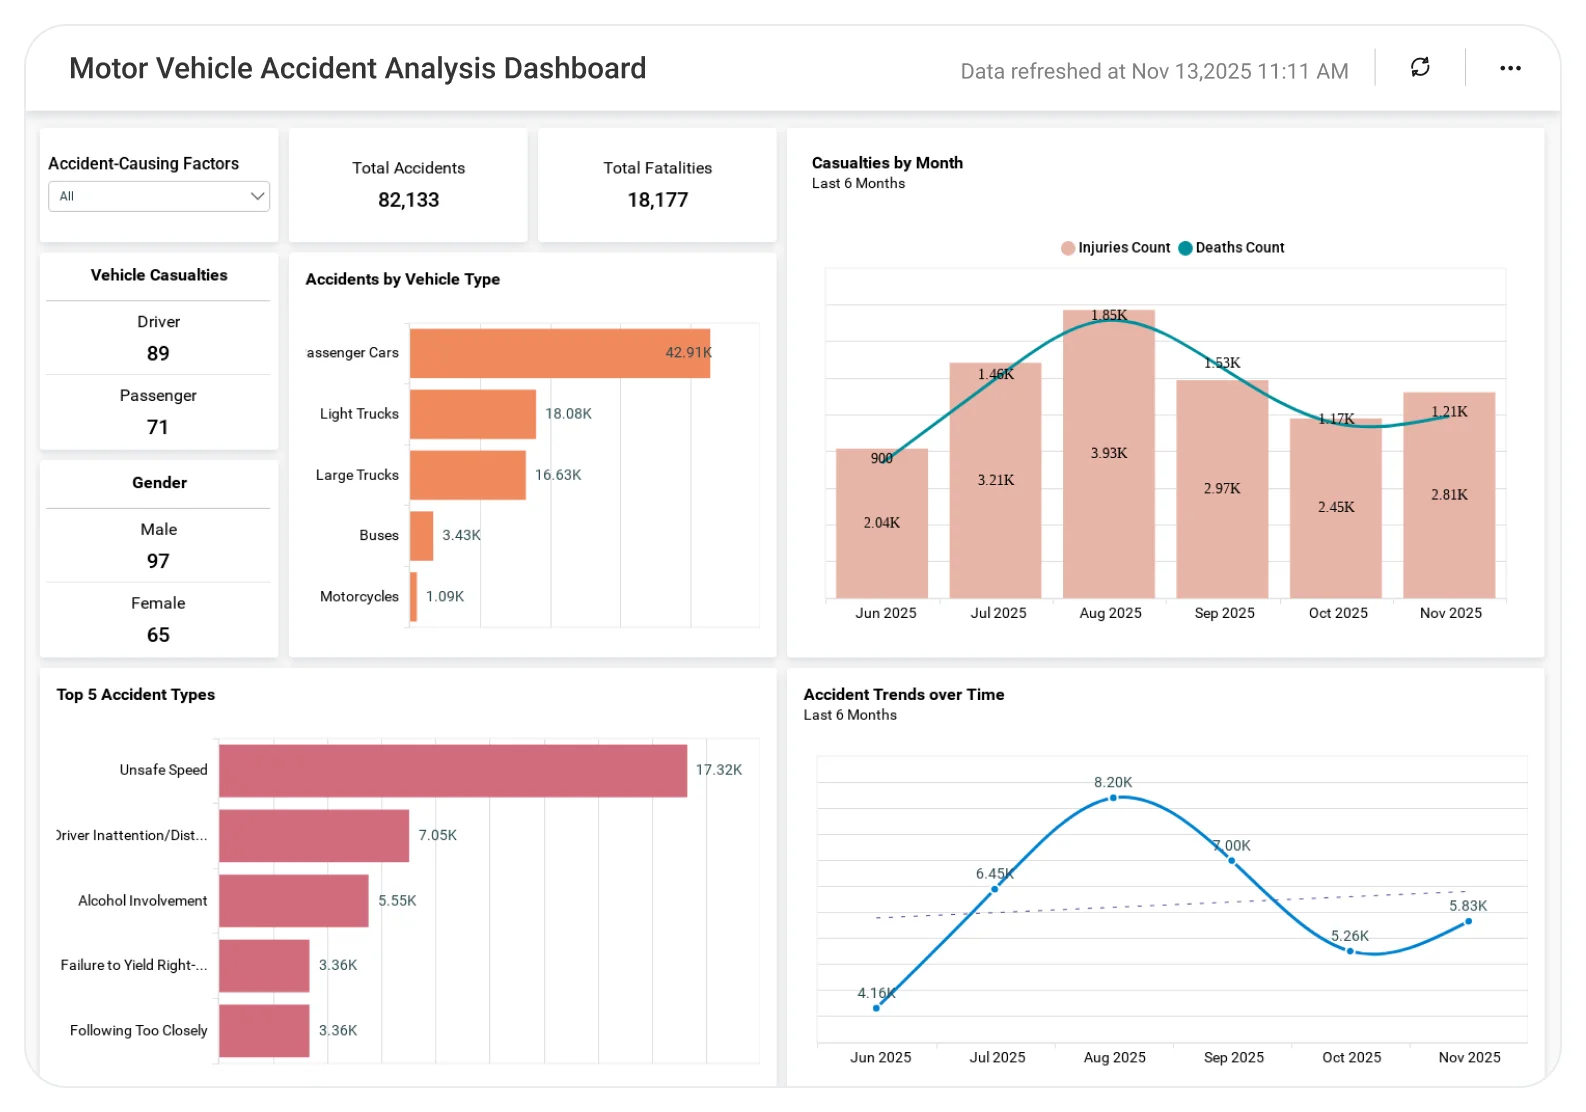
The Motor Vehicle Accidents Analysis Dashboard helps government agencies analyze accident frequency, severity, locations, and contributing factors, enabling targeted safety measures, better enforcement strategies, and data-driven policy decisions.
TL;DR
-
Accidents count by state and region.
-
Monthly accident trends.
-
Primary and secondary contributing factors.
-
Accidents by vehicle type.
-
Accidents by vehicle manufacturing year.
What Is a Motor Vehicle Accidents Analysis Dashboard?
A Motor Vehicle Accidents Analysis Dashboard is a visual analytics solution that helps agencies monitor crash frequency, identify contributing factors, and understand vehicle-related risks across locations and time.
In Bold BI, it becomes an interactive dashboard with charts, maps, and drilldowns automatically updated from transportation and accident data sources.
Why Motor Vehicle Accident Analysis Dashboard Matters
Public safety agencies rely on accurate, timely data to reduce road fatalities and serious injuries.
Without a centralized dashboard:
-
Crash patterns across regions are difficult to compare.
-
Root causes remain hidden in raw data.
-
Policy decisions lack sufficient evidence from consolidated data.
Bold BI brings accident statistics and contributing factors into a single analytical view, so agencies can identify trends and support evidence-based safety initiatives.
What You’ll Track
Using Bold BI dashboards, you will track important KPIs such as:
-
Accident distribution by region: Number of accidents by state and region to identify high-risk areas.
-
Time-based accident trends: Monthly accident counts to detect seasonal or recurring patterns.
-
Contributing factors: Breakdown of crashes by human, environmental, and vehicular causes with detailed drilldowns.
-
Vehicle involvement: Accident counts by vehicle type to understand which vehicles are most frequently involved.
-
Vehicle age analysis: Accidents by vehicle manufacturing year to assess risk related to vehicle age and safety standards.
All dashboards are fully customizable, allowing you to add KPIs or metrics as needed.
How It Works
-
Apply the Motor Vehicle Accidents Analysis sample.
-
Monitor accident trends and contributing factors in real time.
-
Drilldowns into vehicle type and day of accidents.
-
Share dashboards with safety agencies government officials for prevention of future accidents.
Why Bold BI Is the Right Fit for Motor Vehicle Accidents Analytics
-
Centralized crash analytics: Analyze crash causes, vehicle factors, regions, and time-based trends in a single view.
-
Geographic insights: Use map-based visuals to compare accident patterns across states and regions.
-
Actionable drilldowns: Explore contributing factors and vehicle-related risks through interactive drilldowns.
-
Secure & compliant analytics: Protect sensitive public safety data with enterprise-grade security, including Row Level Security, Single Sign On, and Role Based Access Control.
-
Flexible deployment: Deploy dashboards securely in cloud or self-hosted environments to meet government IT requirements.
Compare Options (at a glance)
| Feature | Bold BI Accident Analysis Dashboard | Government Reports | Spreadsheets |
| Regional accident analysis | Yes | Limited | Manual tracking |
| Contributing factor breakdowns | Yes | Limited | Manual Tracking |
| Vehicle type & age analysis | Yes | Limited | Manual Tracking |
| Interactive drilldowns & maps | Yes | Limited | No |
| Executive-ready safety dashboards | Yes | Limited | No |
Frequently Asked Questions
More Articles About Motor Vehicle Accidents Analysis
-
Enhancing Vehicle Accident Analysis with BI Tool
 This blog explains how BI tools like Bold BI® enhance motor vehicle accident analysis by visualizing accident data (such as crashes by location, vehicle type, and time) to spot trends, improve road safety insights, and support better decision-making for prevention and policy.
-
Minimize and Prevent Motor Vehicle Accidents with Bold BI
This blog explains how embedded analytics with Bold BI® can be used to build a motor vehicle accident dashboard that tracks key metrics (like accident counts by state, causes, vehicle types, and time), helping teams monitor trends, improve decision-making, and reduce and prevent road accidents.


