
Crime and Safety Management Dashboard
Improve public safety outcomes, prioritize preventive actions, and support evidence‑based public safety planning and reporting through unified crime and safety insights.
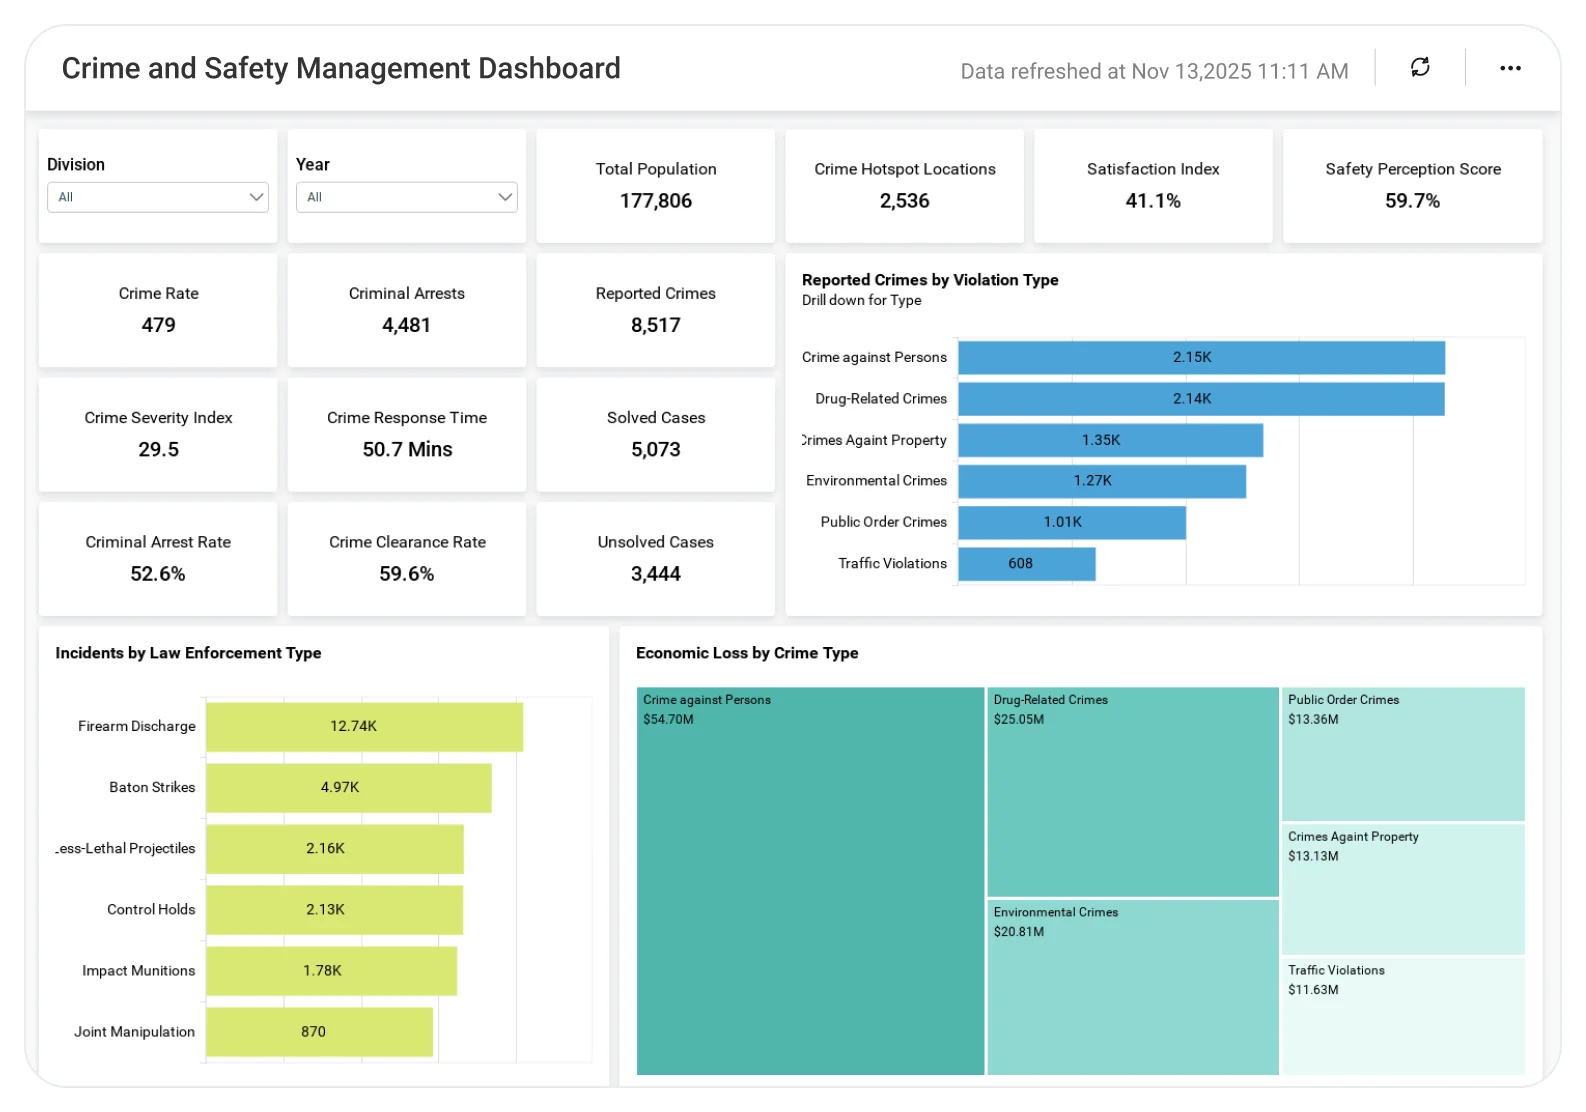
The Crime and Safety Management Dashboard helps city and county leaders analyze crime trends, incident patterns, and safety indicators across neighborhoods and departments, supporting faster response and more informed resource allocation.
TL;DR
-
Centralized assessment results in one unified dashboard across students, classes, programs, and schools.
-
Identify performance gaps and learning trends early to support timely academic interventions.
-
Compare outcomes by subject, grade, cohort, or institution for consistent performance evaluation.
-
Track progress over time across terms or academic years to measure instructional impact.
-
Reduce manual reporting and improve decision-making with reliable, data-driven assessment insights.
What Is a Crime and Safety Management Dashboard?
A Crime and Safety Management Dashboard is an analytics solution that provides a consolidated view of public safety data across jurisdictions, departments, and timeframes.
With Bold BI, aggregated crime and safety data from public safety systems, 311/CRM platforms, GIS, and data warehouses is brought together into interactive dashboards, helping leaders move from fragmented reports to coordinated, citywide safety oversight.
Why Crime and Safety Management Dashboard Matters
Public safety decisions depend on timely, accurate, and contextual information.
When crime and safety data is siloed across systems:
-
Patterns and hotspots are identified too late.
-
Resource deployment becomes more reactive.
-
Cross-department coordination weakens.
-
Council and public reporting becomes inconsistent.
A centralized crime and safety dashboard enables city leaders to move from reactive incident review to proactive safety planning and performance management.
What You’ll Track
Using Bold BI dashboards, you will track important KPIs such as:
-
Crime incident trends: Number of reported incidents over time to understand rising or declining patterns.
-
Geographic crime distribution: Crime counts by district, neighborhood, or zone to identify hotspots.
-
Crime type & severity breakdown: Distribution of incidents by category and seriousness to guide prevention strategies.
-
Response and clearance indicators (aggregated): High-level insights into response patterns and case outcomes for performance monitoring.
All dashboards are fully customizable, allowing you to add KPIs or metrics as needed.
How It Works
-
Connect aggregated public safety data, Excel, and SQL databases or REST APIs.
-
Apply the Crime and Safety Management Dashboard sample.
-
Combine incident data with location and time dimensions in one unified model.
-
Analyze insights by department, district, neighborhood, or time period.
-
Share dashboards with city leadership, department heads, and performance offices.
Why Bold BI Is the Right Fit for Crime and Safety Management Analytics
-
Provides a city-wide view of safety without departmental silos: Aligns leadership, public safety, and operations teams around a shared set of safety indicators.
-
Helps identify crime hotspots and recurring patterns early: Enables proactive interventions by highlighting geographic and temporal concentrations of incidents.
-
Supports equitable and transparent decision-making: Allows leaders to compare safety trends across districts and neighborhoods to guide fair resource allocation.
-
Improves executive, council, and stakeholder reporting: Replaces static reports with clear, drillable dashboards for leadership reviews and public accountability.
-
Scales across large municipalities and multi-agency environments: Designed for cities and counties serving diverse populations and complex jurisdictions.
Compare Options (at a glance)
| Feature | Bold BI | Department Reports | Spreadsheets |
| Crime & safety trend analytics | Yes | Limited | Manual |
| Geographic hotspot analysis | Yes | Partial | Manual |
| Cross-district comparison | Yes | Limited | Manual |
| Executive-ready dashboards | Yes | Limited | No |
| Custom KPIs & drilldowns | Fully customizable | Fixed | Manual |


