
School Performance Dashboard
Understand school performance to improve academic outcomes and decision-making.
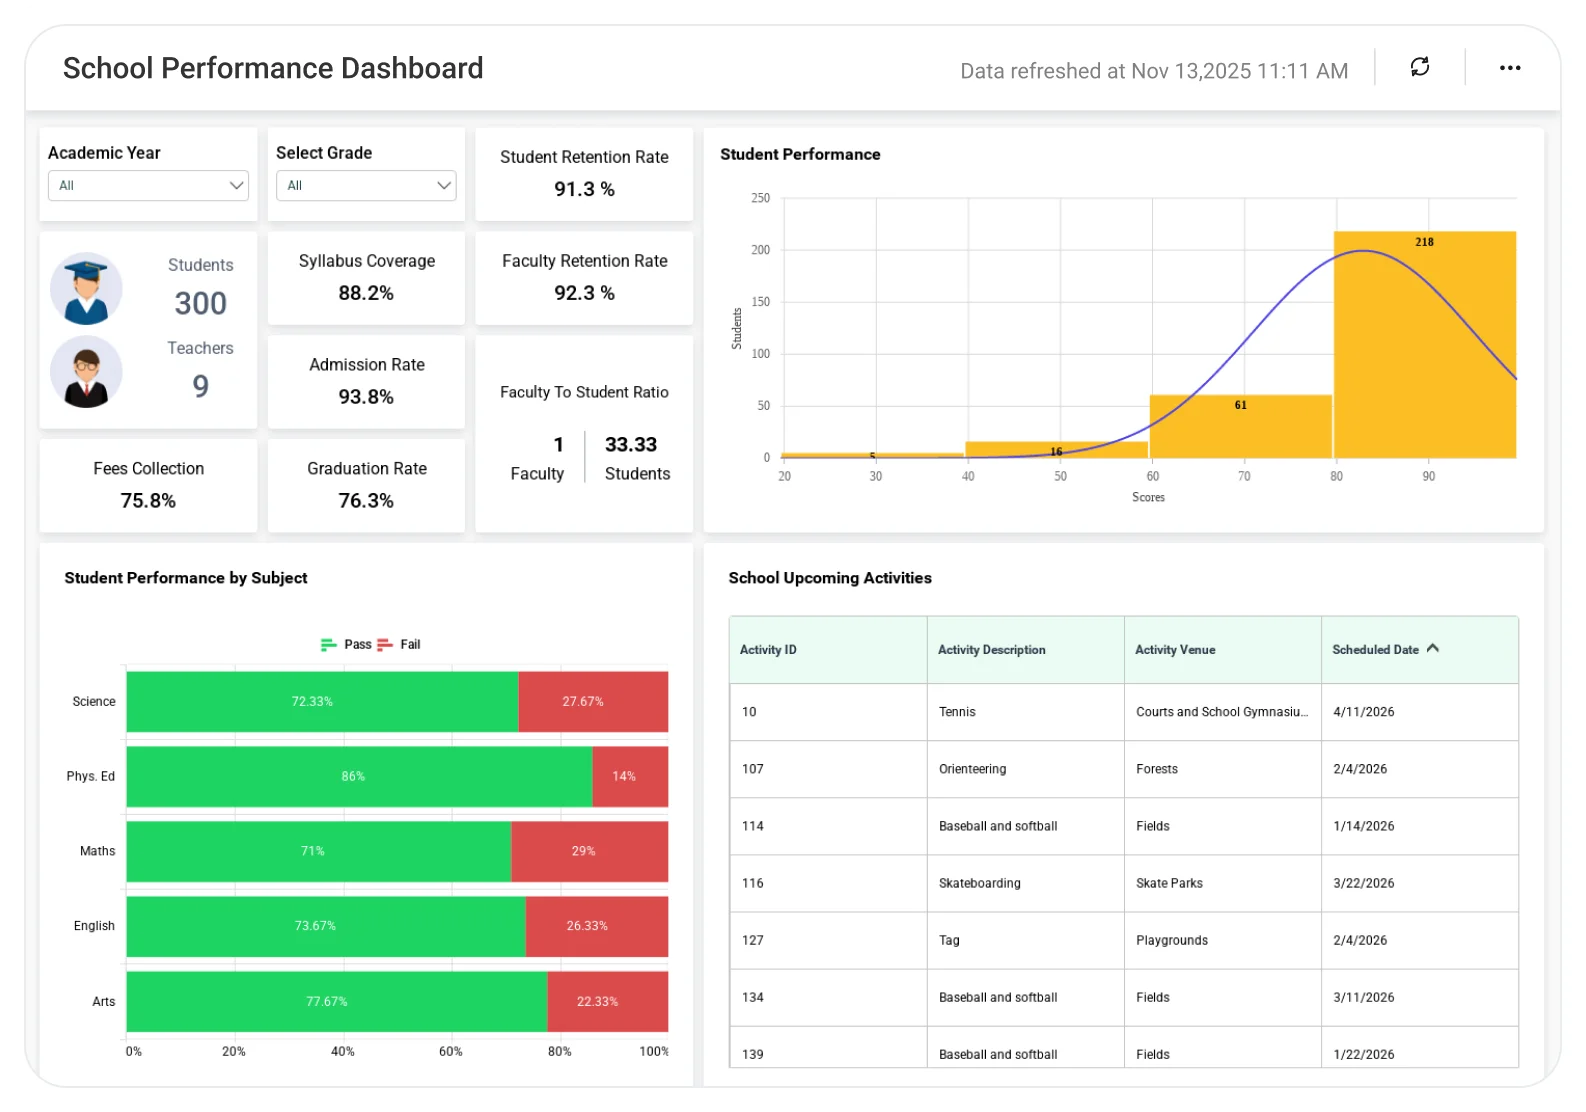
The School Performance Dashboard helps educators and administrators analyze student achievement, attendance, assessment results, and overall school performance, enabling targeted improvements, better planning, and stronger student success.
TL;DR
-
Multi-year enrollment trends: new vs. returning students and faculty.
-
Spot attendance patterns by grade, class, and academic year.
-
Exam performance breakdown: pass, fail, and not attended.
-
Student–faculty ratio and faculty performance metrics.
-
Executive overview of academic trends, retention rates, and overall school health.
What Is a School Performance Dashboard?
School performance refers to how effectively a school supports student learning and manages its academic and operational responsibilities. It combines key indicators such as student results, attendance, enrollment trends, and faculty allocation to give administrators a clear picture of overall school health.
By tracking school performance in one place, education leaders can identify gaps early, support students and teachers better, and make informed decisions that improve outcomes across the school.
Why School Performance Dashboard Matters
Schools manage academic outcomes, attendance, enrollment, and faculty resources every day. When this data is spread across spreadsheets or disconnected systems, leaders struggle to understand what’s working and where support is needed.
School performance analytics gives administrators a clear, shared view of student results, attendance patterns, and operational health, helping them improve learning outcomes, plan staffing effectively, and make faster, data-driven decisions with confidence.
What You’ll Track
-
Enrollment & Population: Track total students and faculty, new vs. returning learners, and year-over-year population trends.
-
Attendance Trends: Monitor attendance by grade and class, overall attendance percentages, and absenteeism patterns.
-
Retention Insights: Analyze student and faculty retention by year to quickly identify grades, programs, or teams with declining retention.
-
Academic Performance: Review exam outcomes with pass, fail, and not-attended breakdowns, along with performance comparisons and learning gaps.
-
Transportation Patterns: Compare school bus and private vehicle usage to support route planning, capacity optimization, and student safety.
-
Faculty Performance Metrics: Access faculty details, attendance, and real-time student–faculty ratios for better planning and compliance.
All the dashboards are fully customizable, letting you add KPIs, adjust thresholds, or blend academic, operational, and behavioral data for a complete view of school performance and operations.
How It Works
Bold BI connects your academic and operational data sources to deliver real-time, actionable dashboards.
-
Connect your data: SIS platforms, Excel, spreadsheets, and operational systems.
-
Automatic refresh: Dashboards stay up to date without manual reports.
-
Secure access: Role-based permissions ensure each team member sees only the data they’re allowed to view.
Why Bold BI Is the Right Fit for School Performance Analytics
-
Unified school insights: Analyze enrollment, attendance, academic results, and faculty allocation in one dashboard.
-
Granular drilldowns: Move from school-level overviews to grade-level and student-level details.
-
Self-service analytics: Enable principals, coordinators, and department heads to explore data without IT dependency.
-
Embedded & flexible deployment: Embed dashboards into school websites, SIS platforms, parent portals, or intranets, and deployment in the cloud or self-hosted environments.
Compare Options (at a glance)
| Feature | Bold BI | State/District Reporting Portals | Spreadsheets |
|---|---|---|---|
| School-wide performance trends (multi-year, grade-level) | Yes | Limited | Manual |
| Assessment proficiency & growth (standards/subject drilldowns) | Yes | Partial | Manual |
| Attendance, chronic absence & engagement monitoring | Yes | Limited | Manual |
| Equity & subgroup gap analysis (demographics/programs) | Yes | Partial | Manual |
| Teacher/class comparisons & instructional insights | Yes | Limited | Manual |
| Operational KPIs (enrollment, staffing, budget) alongside outcomes | Yes | Limited | Manual |
| Custom KPIs & dashboards | Fully customizable | Fixed | Manual |
Frequently Asked Questions
More Articles About School Performance Dashboard
-
Monitor Student Performance with BI Dashboards:
 Explains how BI dashboards improve decision-making, enable timely interventions, and enhance curriculum planning.
-
Embedded Dashboards for Better Education Systems:
Discusses embedding analytics in school portals to track attendance, exam results, and faculty ratios for smarter education systems.
-
Education Dashboard for K-12 Enrollments:
Highlights how embedded analytics helps K-12 schools improve enrollment tracking and decision-making.


