
Assessment Management Dashboard
Get clear visibility into student performance and assessment outcomes across institutions and districts with a centralized analytics dashboard.
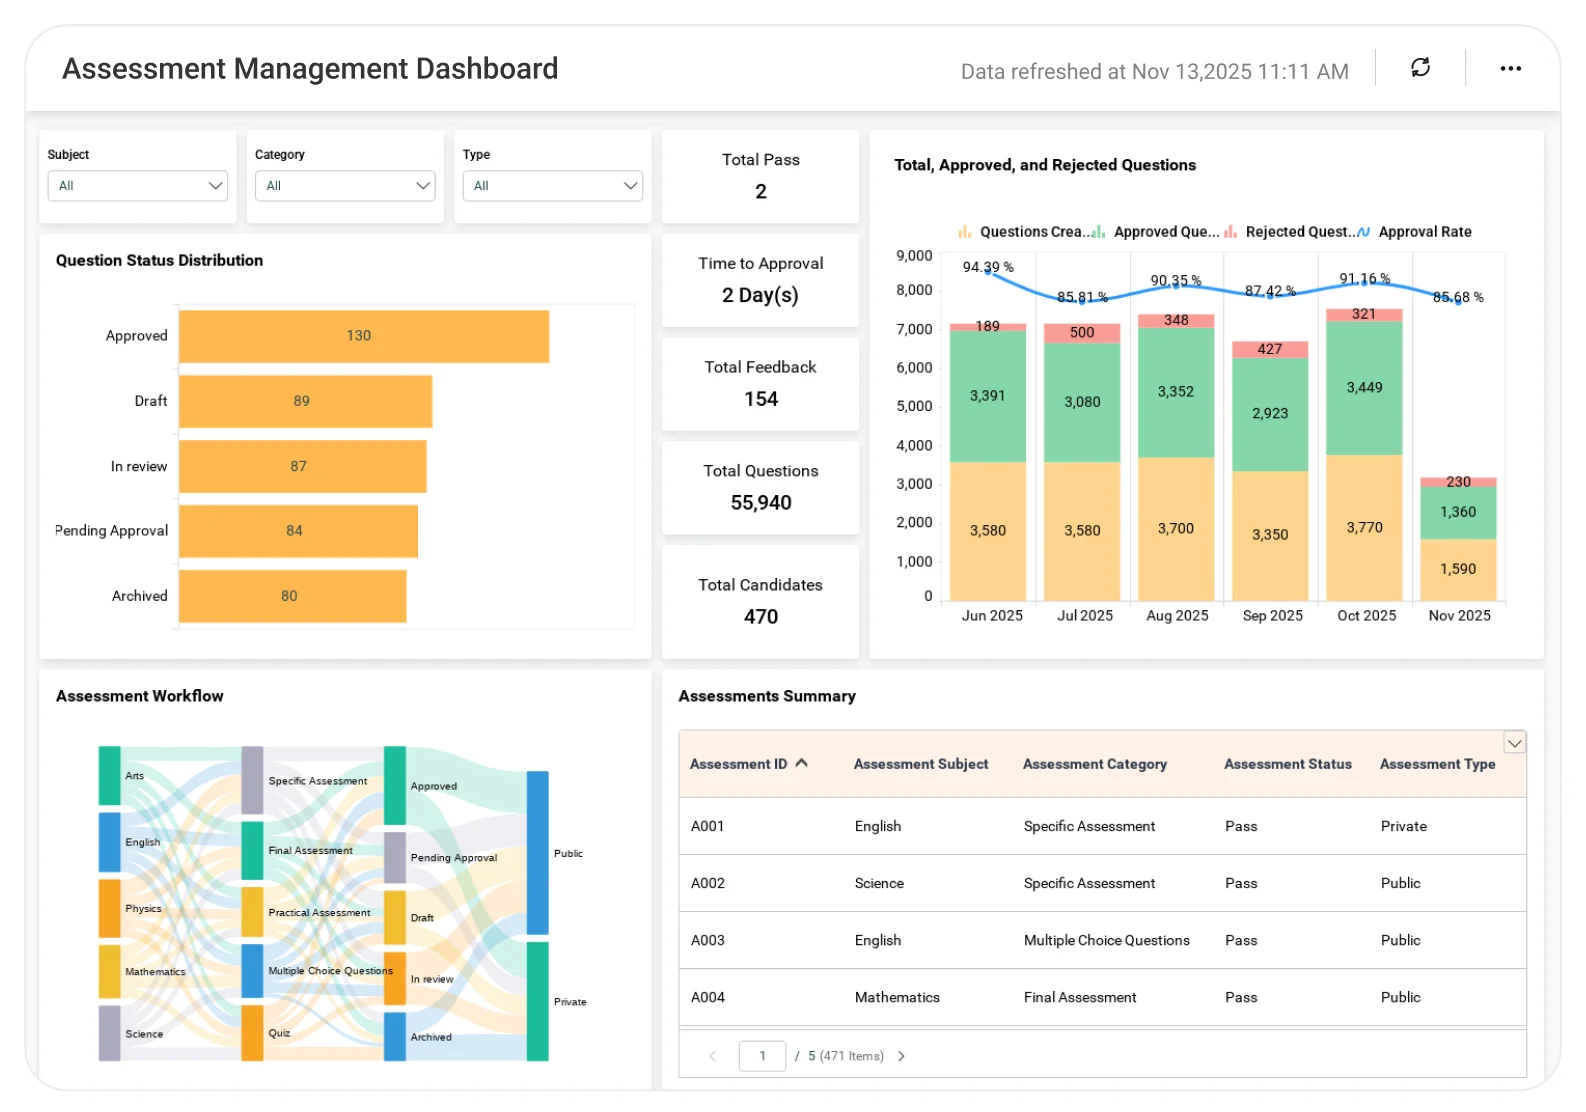
The Assessment Management Dashboard helps education leaders analyze assessment outcomes, identify performance gaps, and track progress across students, classes, programs, and schools without relying on disconnected systems or manual reporting.
TL;DR
-
Centralized assessment results in one unified dashboard across students, classes, programs, and schools.
-
Identify performance gaps and learning trends early to support timely academic interventions.
-
Compare outcomes by subject, grade, cohort, or institution for consistent performance evaluation.
-
Track progress over time across terms or academic years to measure instructional impact.
-
Reduce manual reporting and improve decision-making with reliable, data-driven assessment insights.
What Is an Assessment Management Dashboard?
An Assessment Management Dashboard is an analytics solution that consolidates test scores, evaluations, and academic outcomes into a unified view, enabling institutions to understand learning progress and assessment effectiveness at multiple levels.
With Bold BI, assessment data from SIS, LMS, and assessment platforms is transformed into interactive dashboards that support academic oversight, instructional planning, and evidence‑based decision‑making.
Why Assessment Management Dashboard Matters
Assessment data plays a critical role in academic planning, student success initiatives, and compliance reporting.
When assessment insights are fragmented:
-
Learning gaps are identified too late.
-
Comparisons across schools or programs require manual effort.
-
Intervention planning lacks clear prioritization.
-
Leadership teams rely on static reports that limit timely analysis and action.
A centralized assessment dashboard enables institutions and districts to evaluate outcomes consistently and make timely, evidence-based academic decisions.
What You’ll Track
Using Bold BI dashboards, you will track important KPIs such as:
-
Student & cohort performance outcomes: Analyze assessment scores across students, classes, and cohorts.
-
Subject, grade & program-level results: Compare performance across subjects, grades, departments, or programs.
-
Performance gap identification: Identify underperforming areas that require academic intervention.
-
Assessment trends over time: Evaluate progress and outcome changes across terms or academic years.
All dashboards are fully customizable, allowing you to add KPIs or metrics as needed.
How It Works
-
Apply the Assessment Management Dashboard sample.
-
Combine assessment, academic, and contextual data into unified models.
-
Analyze results by campus, school, program, grade, or subject.
-
Share dashboards with academic leaders, departments, and administrators.
Why Bold BI Is the Right Fit for Assessment Management Analytics
-
Provides a unified academic performance view: Consolidates assessment data across institutions or districts into one dashboard.
-
Supports early academic intervention planning: Makes learning gaps and performance patterns easier to identify.
-
Reduces manual reporting for educators and administrators: Replaces spreadsheets and static assessment reports.
-
Aligns academic, administrative, and leadership teams: Ensures consistent assessment insights across roles.
-
Scales across universities and school districts: Designed for multi-campus universities and multi-school K–12 districts.
Compare Options (at a glance)
| Feature | Bold BI | SIS Reports | Spreadsheets |
| Centralized assessment analytics | Yes | Limited | Manual |
| Multi-level drilldowns | Yes | Partial | Manual |
| Trend & cohort analysis | Yes | Limited | Manual |
| Institution-wide visibility | Yes | Limited | No |
| Custom KPIs & dashboards | Fully customizable | Fixed | Manual |


