
Construction Quality Management Dashboard
Identify quality issues early to reduce rework and ensure compliance across construction projects.
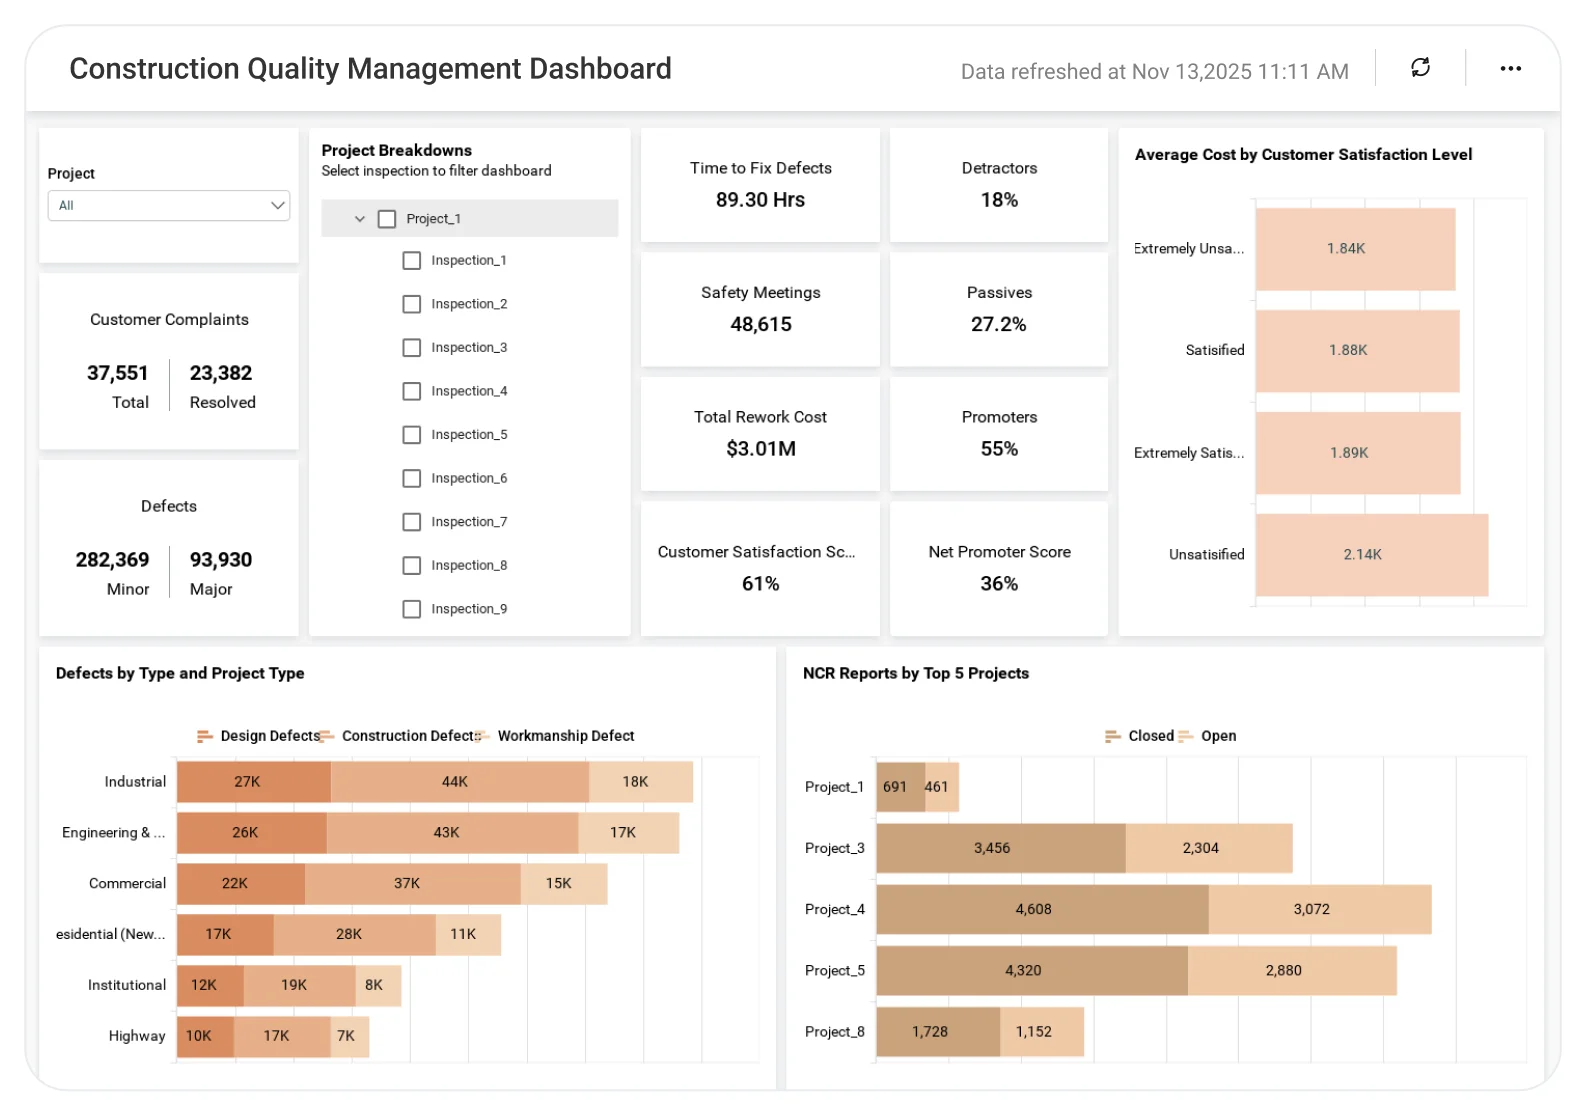
The Quality Management Dashboard helps teams analyze inspections, defects, and non-conformance trends, enabling better quality control, lower rework costs, and safer project delivery.
TL;DR
-
Site inspection, pass rate, and safety activity.
-
Number of defects by type and project.
-
Rework costs and defect resolution time.
-
Open vs. resolved quality issues.
-
Customer satisfaction and Net Promoter Score trends.
What Is a Construction Quality Management Dashboard?
A Construction Quality Management Dashboard is a visual analytics solution that helps teams monitor safety compliance, workmanship quality, defect resolution, rework costs, and customer satisfaction across projects.
In Bold BI, it becomes an interactive dashboard with KPIs, charts, and filters that update automatically from quality and project data sources.
Why a Construction Quality Management Dashboard Matters
Construction quality directly affects safety outcomes, project costs, timelines, and customer trust.
Without a centralized quality dashboard:
-
Defect patterns are difficult to identify.
-
Rework costs increase without clear accountability.
-
Customer dissatisfaction is discovered too late.
Bold BI brings safety, quality, and customer data into one dashboard, so teams can detect issues earlier and address them consistently.
What You’ll Track
-
Safety performance: Site inspection pass rates, safety meetings held, and overall safety compliance indicators.
-
Defects & non-conformance: Number of defects by type and project, along with open vs. closed non-conformance reports.
-
Rework impact: Rework costs and average time required to fix defects, helping quantify quality issues.
-
Customer satisfaction: Net Promoter Score, total and resolved complaints, and satisfaction distribution.
-
Project-level trends & comparisons: Analyze safety, defects, rework, and satisfaction across projects and project types using project and project type filters.
All dashboards are fully customizable, allowing you to add KPIs or metrics as needed.
How It Works
-
Apply the Construction Quality Management Dashboard sample.
-
Review quality KPIs, defect counts, and compliance metrics.
-
Track inspection trends and issue resolution timelines over time.
-
Share dashboards with project managers, site engineers, and leadership teams for real-time visibility.
Why Bold BI Is the Right Fit for Construction Analytics
-
Portfolio-wide insights: Track safety, defects, rework, and quality performance across multiple projects and project types.
-
Project-level drilldowns: Drill into individual projects to identify quality risks, defect resolution time, and rework impact.
-
Focused analysis for reviews: Use filters and comparisons to support quality reviews, audits, and project evaluations.
-
Secure & controlled access: Protect sensitive project data using Row Level Security(RLS), Single Sign On(SSO), and Role Based Access Control(RBAC).
Compare Options (at a glance)
| Feature | Bold BI | Project Reports | Spreadsheets |
| Safety & inspection tracking | Yes | Limited | Manual |
| Defect & rework analysis | Yes | Limited | Manual |
| Customer satisfaction insights | Yes | Limited | Manual |
| Project-level comparisons | Yes | Limited | Manual |
| Executive-ready dashboards | Yes | Limited | No |
Frequently Asked Questions
More Articles About Construction Quality Management
-
Restructuring the Construction Industry with Embedded Analytics
 This blog explains how embedded analytics helps construction teams monitor project performance, quality metrics, and operational data directly within internal systems.
-
Enhance the Quality of Construction Projects with Analytics
This blog shows how construction dashboards help track defects, rework, safety metrics, and quality indicators to improve project outcomes and customer satisfaction.


