
Construction Project Monitoring Dashboard
Understand project progress and risks to ensure timely and cost-effective construction delivery.
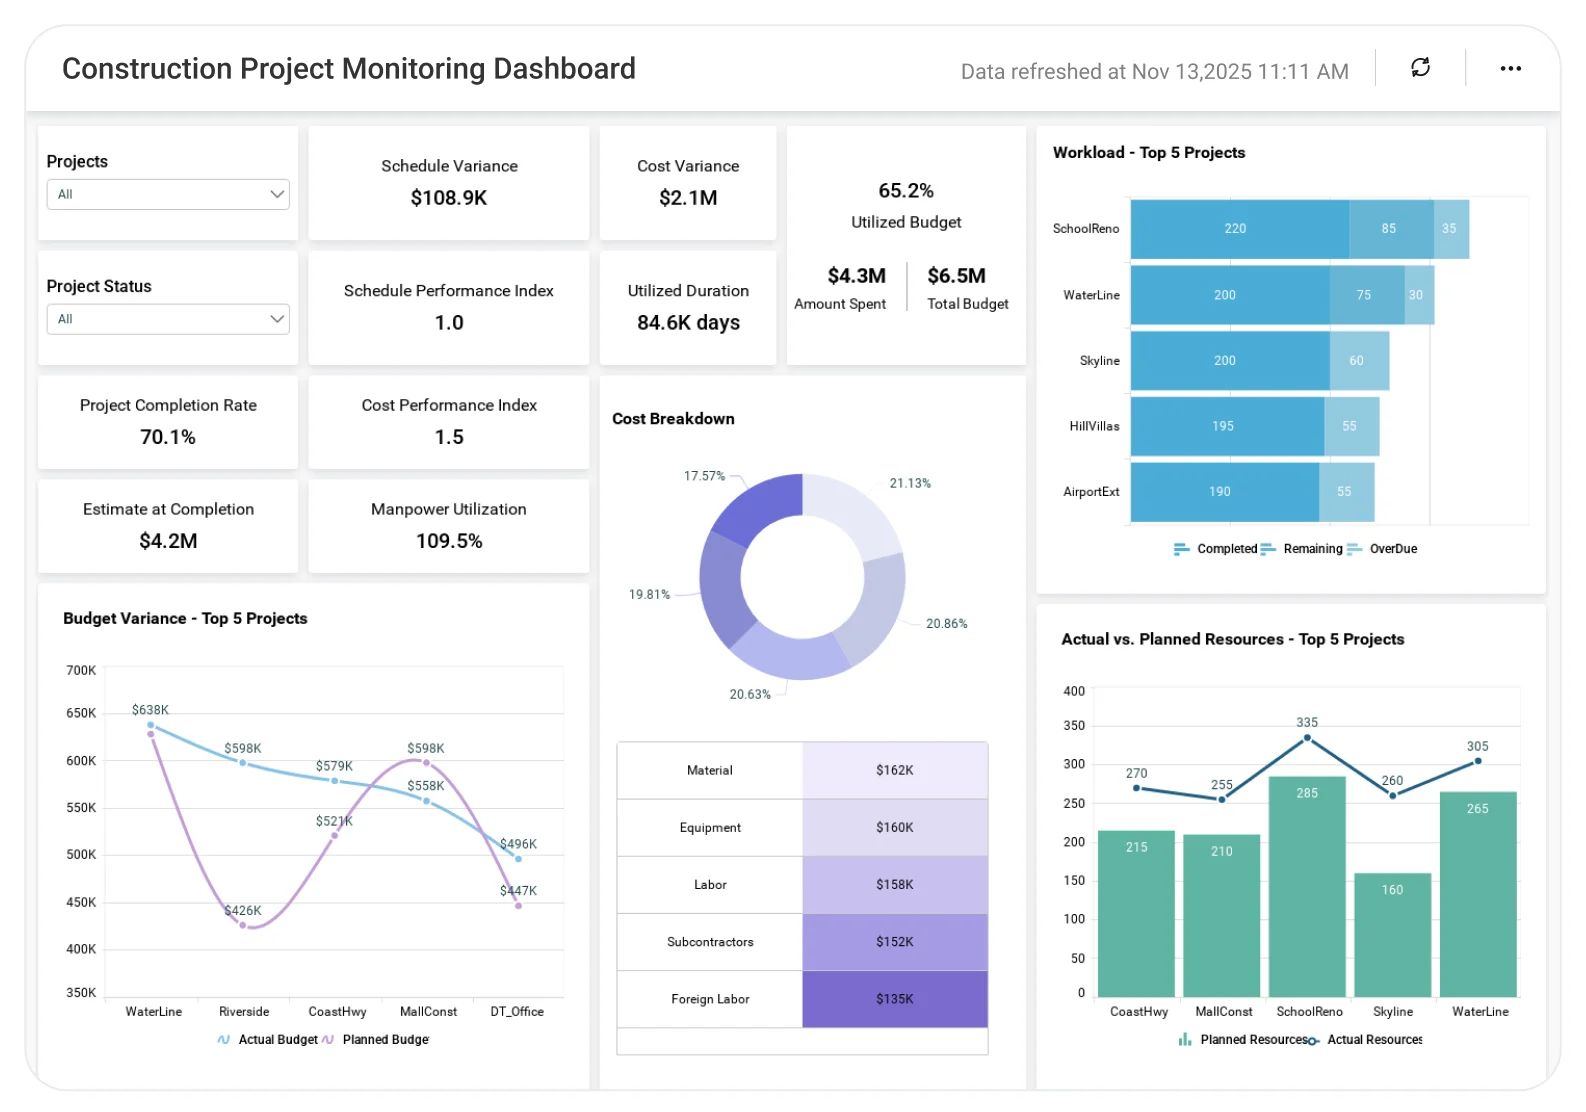
The Project Monitoring Dashboard helps teams analyze schedules, budgets, task progress, and potential risks, enabling better coordination, proactive issue resolution, and more predictable project outcomes.
TL;DR
-
Budget tracking: Spending, remaining funds, cost variance.
-
Project progress view: Work completed, in progress, and not started.
-
Project stage analysis: From planning to closeout.
-
Overdue workload insights: Tasks behind schedule.
-
Resource allocation: Labor, equipment, contractors, and its utilization.
What is a Construction Project Monitoring Dashboard?
A Construction Project Monitoring Dashboard gives you a real-time view of project health covering cost performance, schedule status, task progress, and resource utilization. It helps you spot delays, budget overruns, and bottlenecks before they impact delivery.
With Bold BI, you get interactive visuals for cost tracking, task timelines, project phases, overdue workloads, and workforce or equipment allocation all in one dashboard.
Why Construction Project Monitoring Dashboard Matters
There are different factors that make a construction project complex. Shifting budgets, delays in timelines, and resource mismanagement can even lead to cost escalation.
Bold BI helps you answer the questions that matter most:
-
How much have we spent compared to the budget?
-
Is the team completing work on schedule?
-
Are projects moving through stages as expected?
-
Where are delays occurring and why?
-
Which resources are overloaded or underused?
What You’ll Track
-
Budget spent: How much of the budget is used, remaining cost, variances, and key spending areas like materials and procurement.
-
Work status: What’s completed, in progress, or not started across tasks, phases, and sites.
-
Project stages: Where each project sits in the lifecycle and which stages are running behind.
-
Overdue workload: Tasks that are late, how long they’ve slipped, and where schedule risks are building.
-
Resource allocation: How labor, equipment, and contractors are being used, including over-allocation and idle time.
All dashboards are fully customizable. Add your own KPIs, set thresholds, and blend data from multiple sites or contractors.
How It Works
-
Apply: The Construction Project Monitoring sample.
-
Blend: Budget, progress, scheduling, and resource metrics.
-
Share: Secure dashboards with PMs, superintendents, and executives.
-
Set alerts: For cost overruns, overdue tasks, and resource bottlenecks.
Why Bold BI Is the Right Fit for Construction Analytics
-
Unified construction intelligence: Combine cost, schedule, risk, resource, procurement, HR, and equipment data into one dashboard.
-
End-to-end project drilldowns: Drill from portfolio-level overviews down to site-level and individual project tasks.
-
Real-time project visibility: Use live field updates to track accurate project status across phases and locations.
-
Built for complex projects: Ideal for multi-site, multi-phase, and long-duration construction programs.
-
Secure & governed access: Protect sensitive project and financial data using Row Level Security(RLS), Single Sign On(SSO), and Role Based Access Control(RBAC) with encryption.
-
Self-service for all roles: Enable superintendents, project managers, and executives to analyze data independently.
Compare Options (at a glance)
| Feature | Bold BI | Project Management Tool Reports | Spreadsheets |
|---|---|---|---|
| Schedule tracking (planned vs. actual milestones) | Yes | Limited | Manual |
| Budget monitoring (planned vs. actual costs) | Yes | Partial | Manual |
| Cost variance, burn rate & forecast | Yes | Limited | Manual |
| Resource utilization (labor/equipment) visibility | Yes | Partial | Manual |
| Change orders, RFIs & issue tracking analysis | Yes | Limited | Manual |
| Quality & safety incident trend reporting | Yes | Limited | Manual |
| Custom KPIs & dashboards | Fully customizable | Fixed | Manual |
Frequently Asked Questions
More Articles About Construction Project Monitoring
-
15 Best KPI Dashboard Examples for Your Business:
 KPI dashboards help businesses in all industries see the story that lives behind their data by presenting it graphically. The document shows the 15 Best Dashboard Examples for your business.
-
Unravelling Complexity with Root-Cause Analysis:
Explains how root-cause analysis can help construction teams identify and resolve recurring issues effectively.


