
Retail Sales Sell-Out Dashboard
Improve customer-facing sales performance, optimize inventory availability, and maximize margins with clear sell‑out visibility across channels.
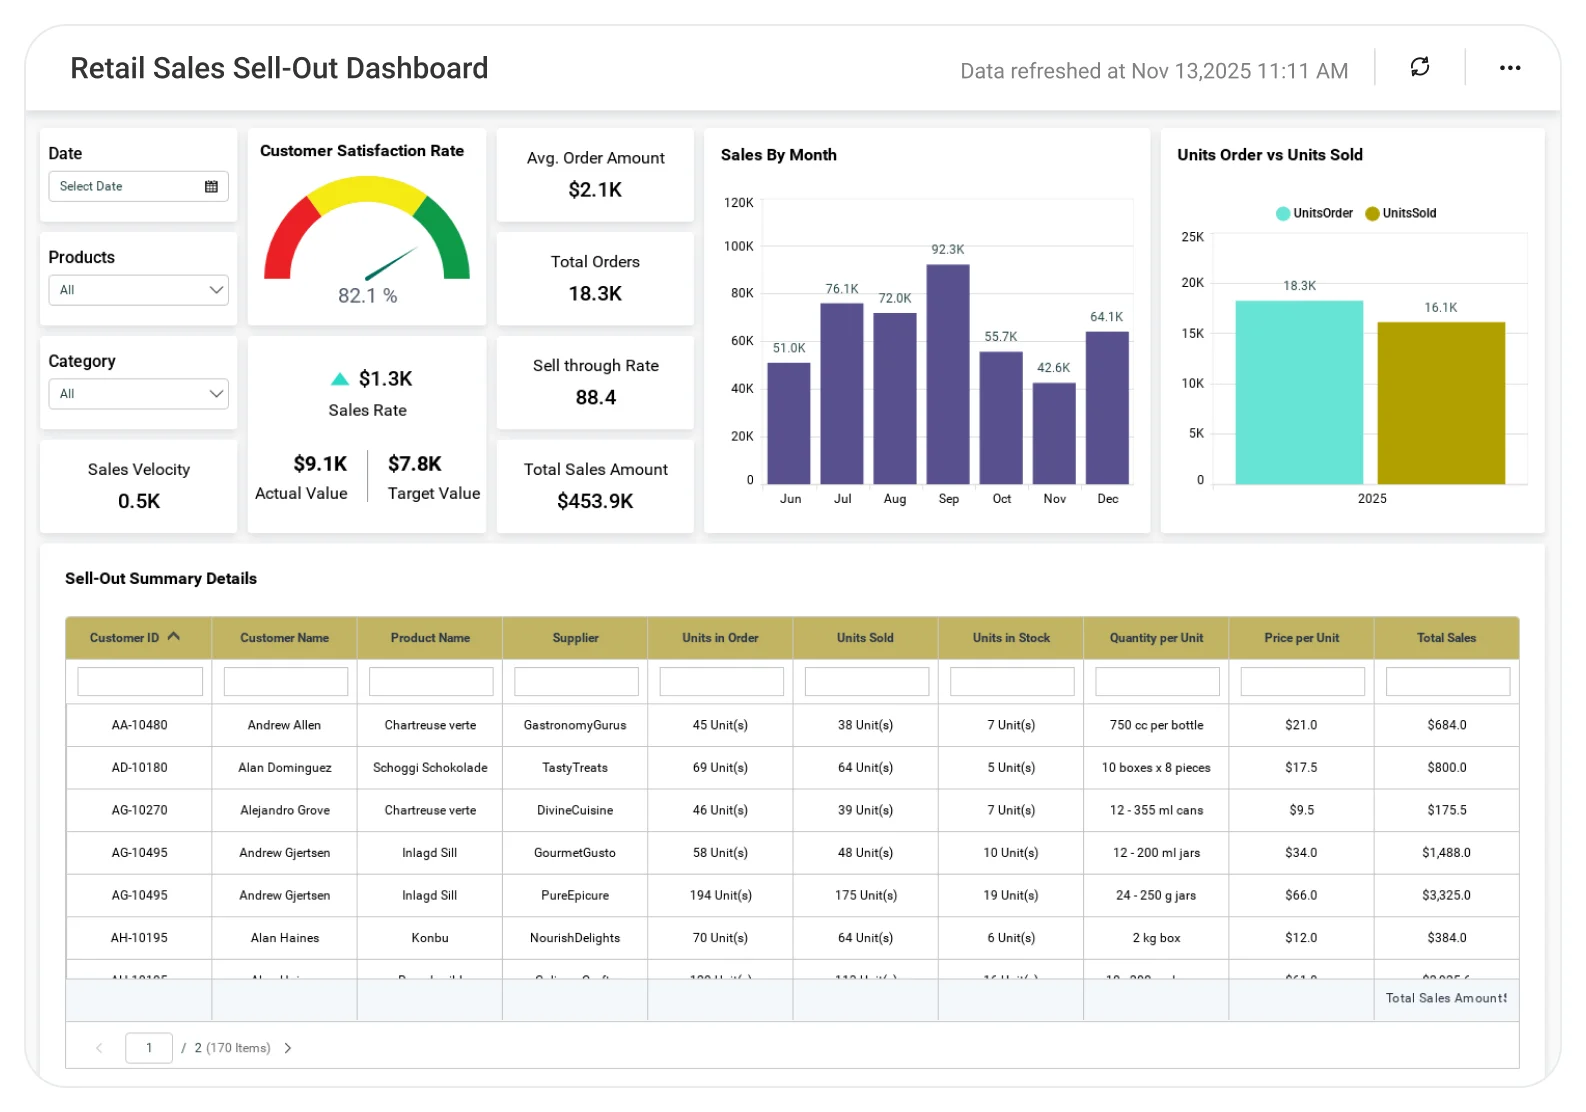
The Retail Sales Sell‑Out Dashboard helps omnichannel retailers and D2C brands see how products actually sell to customers across stores and eCommerce so teams can respond faster to demand, reduce stockouts, and improve sell‑through.
TL;DR
-
Track sell-out revenue and unit sales trends to understand true customer demand.
-
Monitor sell-through performance by SKU, category, and channel to optimize assortments.
-
Identify stockouts, OSA gaps, and aged inventory risks tied directly to sell-out behavior.
-
Analyze the impact of promotions and pricing changes on customer sales and margins.
-
Improve availability, margins, and demand-driven decisions with data-backed sell-out insights.
What Is a Retail Sales Sell-Out Dashboard?
A Retail Sales Sell‑Out Dashboard is an analytics solution that tracks customer purchases across physical stores and digital channels, showing what actually leaves the shelf or cart.
With Bold BI, sell‑out data from POS, eCommerce platforms, ERP, and fulfillment systems is unified into a single analytical view, helping retailers connect customer demand with inventory, pricing, and operational decisions in real time.
Why Retail Sales Sell-Out Dashboard Matters
Sell-out performance reflects real customer demand and directly impacts revenue, margin, and customer experience.
When sell-out data is fragmented:
-
Stockouts are discovered after lost sales occur.
-
Slow-moving SKUs linger without corrective action.
-
Promotions are evaluated too late.
-
Merchandising and supply teams work from different numbers.
A centralized sell-out dashboard helps retailers shift from lagging reports to real-time, demand-driven decisions.
What You’ll Track
Using Bold BI dashboards, you will track important KPIs such as:
-
Sell-out revenue & units: Customer sales volume and value by store, channel, category, and SKU.
-
Sell-through rates: How quickly inventory converts to sales to evaluate assortment effectiveness.
-
Inventory availability indicators: OSA, stockouts, and aged inventory linked directly to sell-out performance.
-
Promotion & pricing impact: Sales lift and margin impact during promotions or price changes.
All samples are easy to tailor, and you can add your own KPIs or connect data from any department.
How It Works
From data connection to live dashboards in hours, not weeks.
-
Apply the Retail Sales Sell-Out Dashboard sample.
-
Combine sales, inventory, pricing, and fulfillment data into a unified model.
-
Analyze insights by region, store, channel, category, or SKU.
-
Share dashboards with merchandising, supply chain, eCommerce, and leadership teams.
Why Bold BI Is the Right Fit for Retail Sales Sell-Out Analytics
-
Shows what customers buy, not just what’s shipped: Provides a true demand signal across stores and digital channels for better planning.
-
Reduces lost sales from stockouts and availability gaps: Links sell-out trends with OSA and stockout metrics so teams can act before shelves go empty.
-
Improves assortment and markdown decisions: Highlights fast- and slow-moving SKUs to guide pricing, promotions, and assortment changes.
-
Aligns merchandising, operations, and growth teams: Creates a shared, trusted view of customer sales across channels and departments.
-
Scales across large omnichannel and D2C operations: Designed for retailers managing hundreds of stores, multiple digital channels, and large SKU catalogs.
Compare Options (at a glance)
| Feature | Bold BI | POS / eCom Reports | Spreadsheets |
| Sell-out performance analytics | Yes | Limited | Manual |
| SKU & category sell-through insights | Yes | Partial | Manual |
| Stockout & OSA visibility | Yes | Limited | Manual |
| Omnichannel sales analysis | Yes | Limited | No |
| Custom KPIs & drilldowns | Fully customizable | Fixed | Manual |
Frequently Asked Questions
More Articles About Retail Sales Sell-Out
-
Online Retail Inventory Optimization with Visualization
 Explains how data visualization improves inventory optimization for online retailers, with tips on demand forecasting and turnover analysis.
-
Benefits of Embedded Analytics in Retail Industry
Discusses how embedded analytics improves inventory management, customer retention, and operational efficiency in retail.


