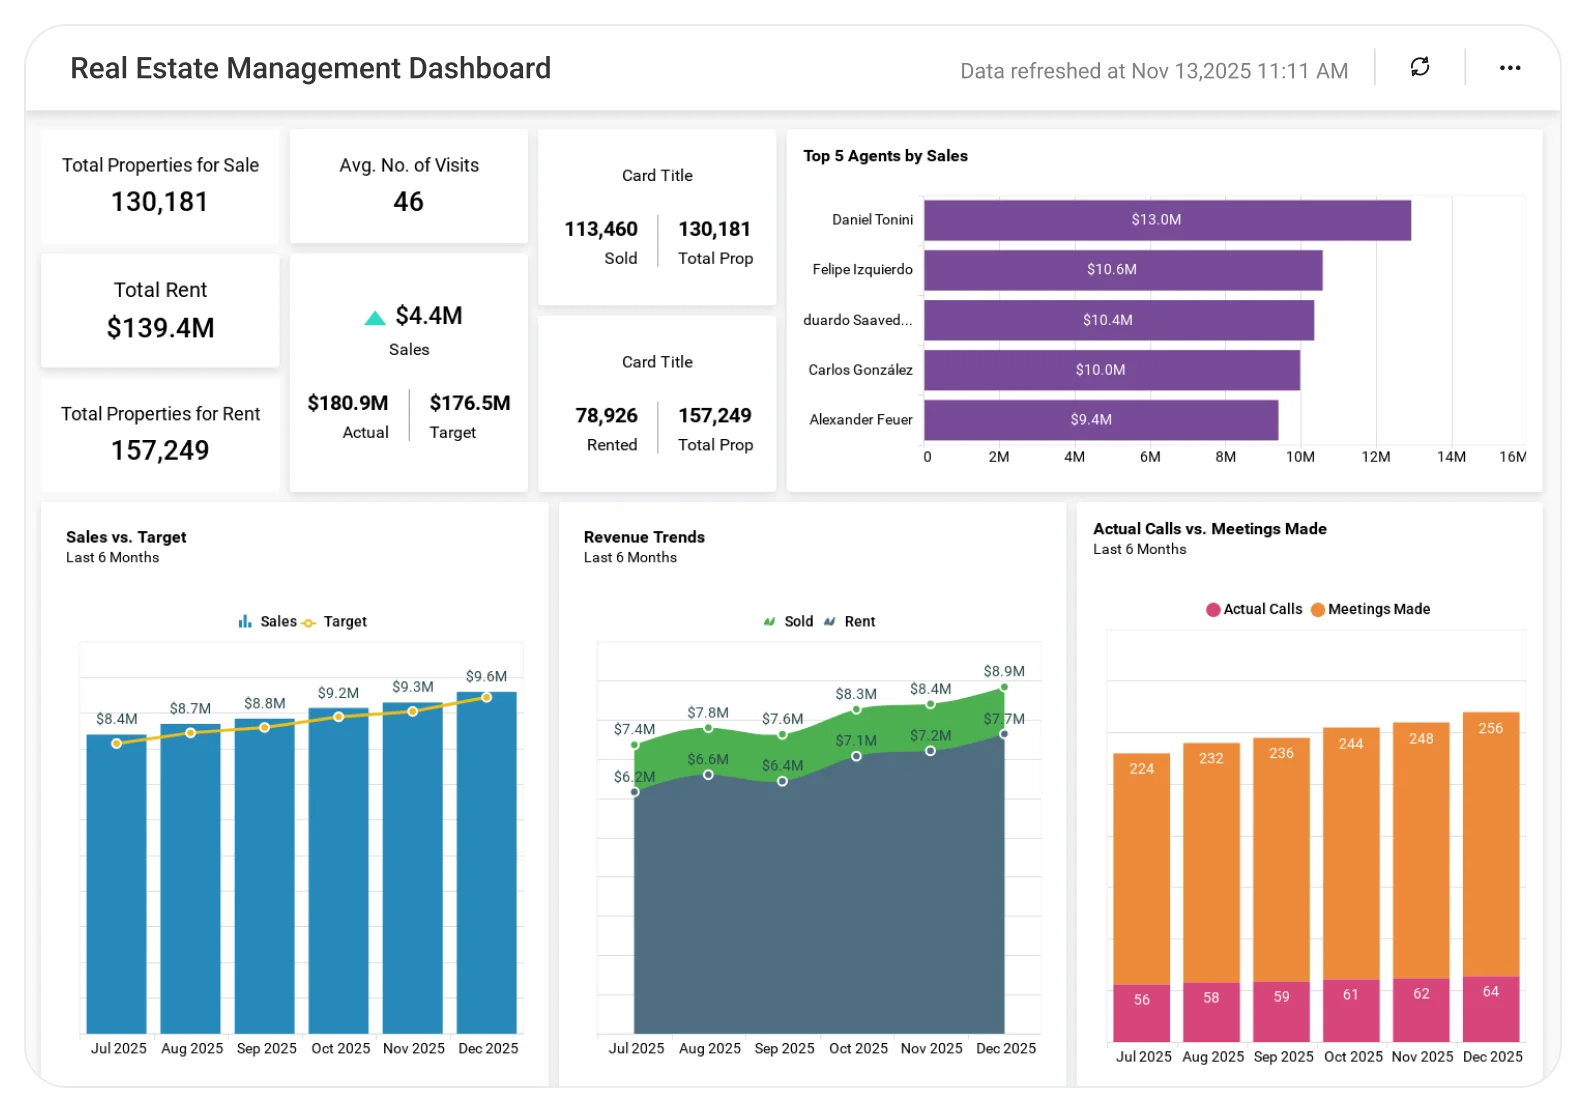
Real Estate Management Dashboard
Understand real estate portfolio performance to improve profitability and operational efficiency.
The Real Estate Management Dashboard helps teams analyze occupancy rates, rental income, operating costs, and property-wise performance, enabling better asset planning, cost control, and informed property management decisions.
TL;DR
-
Sales and rental revenue overview.
-
Properties available for sale and rent.
-
Time-on-market insights.
-
Advertising and promotion costs.
-
Customer inquiries and referral sources.
What Is a Real Estate Management Dashboard?
A Real Estate Management Dashboard is a visual analytics solution that helps companies monitor property inventory, sales performance, rental income, marketing spend, and customer engagement.
In Bold BI, it becomes an interactive dashboard with KPIs, charts, maps, grids, and filters that automatically update from real estate data sources.
Why Real Estate Management Dashboard Matters
Real estate teams must balance inventory, revenue targets, marketing spend, and agent performance.
Without a centralized dashboard:
-
Sales and rental performance are hard to track.
-
Marketing ROI is unclear.
-
Agent productivity lacks visibility.
What You’ll Track
-
Sales & rental revenue: Total revenue generated from property sales and rentals.
-
Property inventory: Number of properties available for sale and rent.
-
Market performance: Sales versus target, regional performance, and time-on-market insights.
-
Agent productivity: Properties sold and rented by each agent to assess individual performance.
-
Marketing impact & inquiries: Advertising costs and customer referral sources to evaluate marketing effectiveness.
All dashboards are fully customizable, allowing you to add KPIs or metrics as needed.
How It Works
-
Select the Real Estate Management Dashboard sample.
-
Blend sales, rental revenue, property inventory, agent performance, and marketing data in one view.
-
Share role-based dashboards with brokers, sales agents, and leadership teams.
-
Track market performance, optimize advertising spend, and improve sales and rental outcomes.
Why Bold BI Is the Right Fit for Real Estate Analytics
-
Centralize business performance tracking: Combines revenue, inventory, agent performance, and marketing metrics in one view.
-
Support market-level analysis: Enables region-wise and agent-wise performance comparisons.
-
Enable actionable insights: Drill down into individual properties, agents, and campaigns to identify what drives results.
-
Marketing & sales alignment: Track advertising spend versus outcomes and enable faster follow-ups on leads.
-
Deploy flexibly: Supports cloud and self-hosted deployment for real estate operations.
Compare Options (at a glance)
| Feature | Bold BI Real Estate Management Dashboard | Real Estate Reports | Spreadsheets |
| Sales & rental revenue tracking | Yes | Limited | Manual |
| Property inventory visibility | Yes | Limited | Manual |
| Agent performance analysis | Yes | Limited | Manual |
| Marketing cost & ROI insights | Yes | Limited | Manual |
| Executive-ready dashboards | Yes | Limited | No |
Frequently Asked Questions
More Articles About Real Estate Management Dashboard
-
Unveiling Real Estate Market Trends and Insights with the Power of BI
Explains how real estate teams use BI dashboards to analyze market trends, sales performance, regional demand, and pricing patterns for smarter decision-making.
-
The Benefits of Embedded Analytics in Real Estate
Shows how embedded analytics helps real estate teams access sales, inventory, and marketing insights directly within their internal systems improving efficiency and responsiveness.
-
Monitoring a Real Estate Business and Market Trends
Demonstrates how dashboards help monitor property inventory, time on market, agent performance, and overall business health using real-time analytics.