
Online Food Ordering Dashboard
Analyze ordering behavior and predict demand to optimize online food delivery operations.
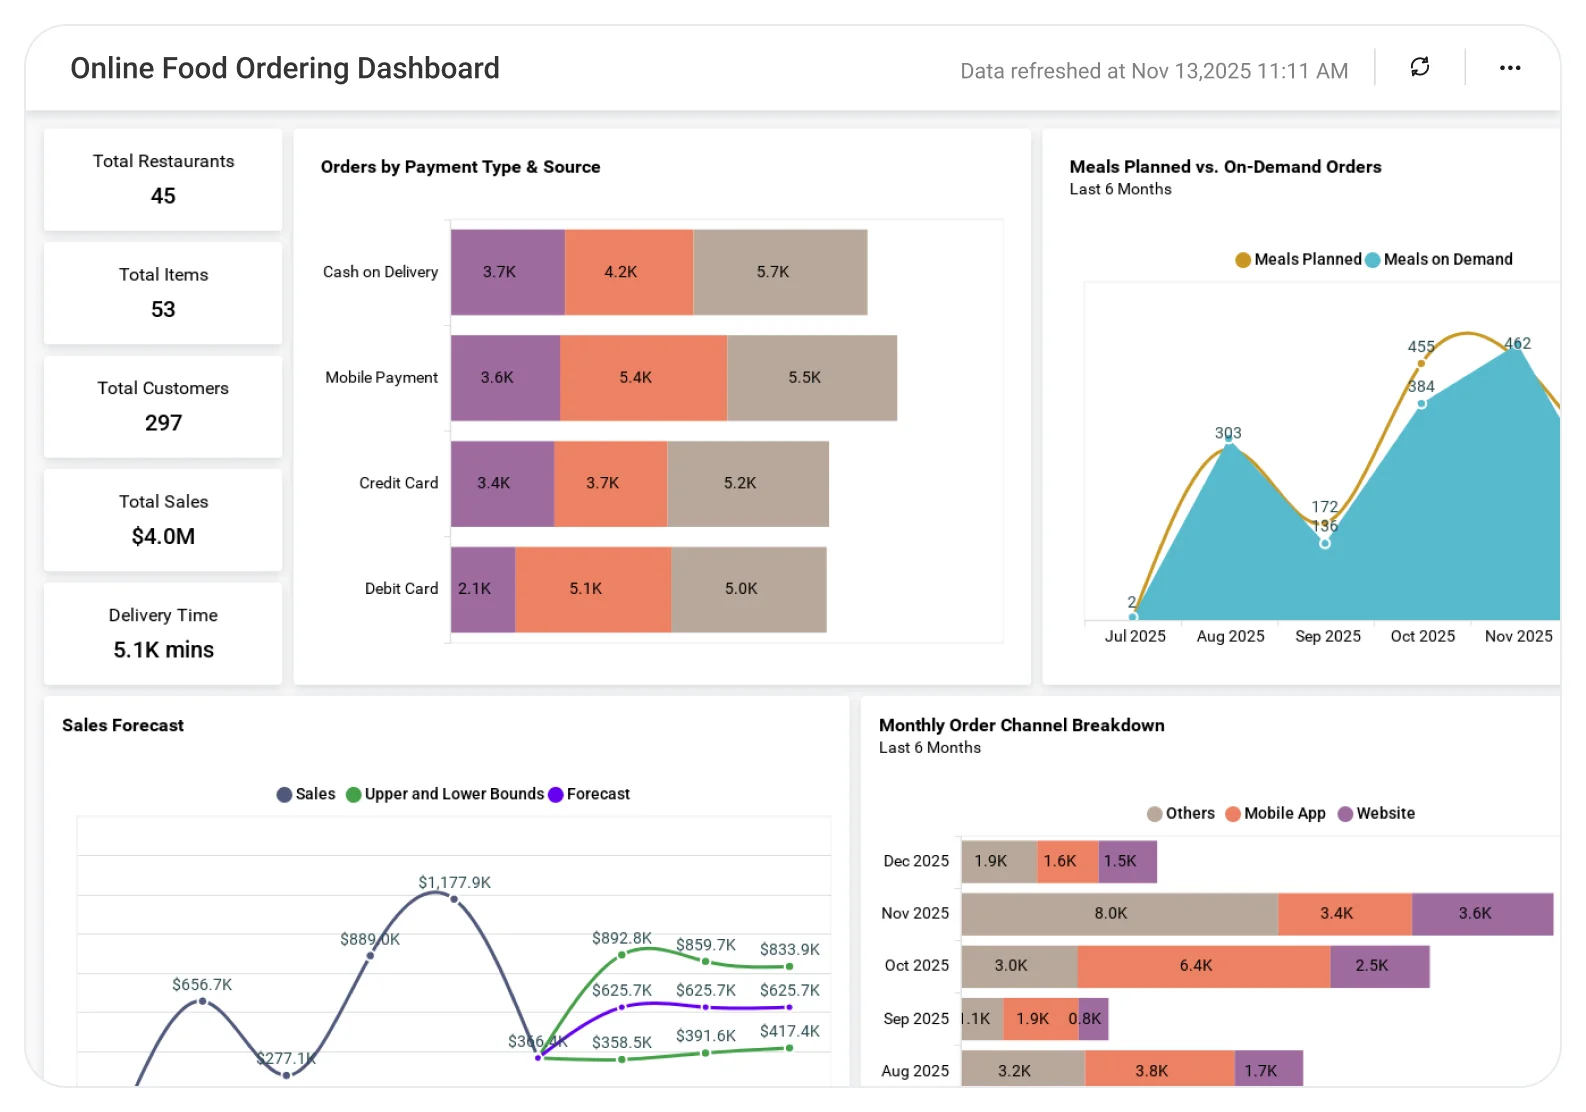
The Online Food Ordering Analysis Dashboard helps businesses analyze order trends, customer preferences, peak demand periods, and forecast future orders, enabling better inventory planning, faster fulfillment, and improved customer satisfaction.
TL;DR
-
Revenue and expense overview.
-
Online vs. mobile app order volume.
-
Busiest ordering days.
-
Restaurant-wise delivery time insights.
-
Customer satisfaction trends.
What Is an Online Food Ordering Analysis Dashboard?
An Online Food Ordering Analysis Dashboard is a visual analytics solution that helps food delivery businesses track orders, revenue, delivery efficiency, and customer satisfaction over time.
In Bold BI, it becomes an interactive dashboard with KPIs, charts, forecasts, and filters automatically updated from ordering and delivery data sources.
Why an Online Food Ordering Analysis Dashboard Matters
Food delivery operations depend on tight coordination between demand, delivery capacity, and customer experience.
Without a centralized dashboard:
-
Revenue trends are hard to forecast.
-
Peak demand days are difficult to plan for.
-
Delivery delays impact customer satisfaction.
Bold BI brings financial, operational, and customer data together so teams can optimize delivery performance and improve customer retention.
What You’ll Track
-
Revenue & expenses: Total revenue, operating expenses, and forecasted revenue trends.
-
Order channels: Comparison of orders placed through mobile apps versus websites.
-
Demand patterns: Busiest days of the week to support driver and resource planning.
-
Delivery performance: Average delivery time by restaurant to identify delays and improve efficiency.
-
Customer satisfaction: Satisfaction ratings to measure service quality and customer experience.
All dashboards are fully customizable so you can add KPIs or metrics as needed.
How It Works
-
Select the Online Food Ordering Analysis Dashboard sample.
-
Blend orders, revenue, expenses, delivery times, and customer satisfaction data in one view.
-
Share role-based dashboards with operations, marketing, and leadership teams.
-
Track demand patterns, optimize delivery performance, and improve customer experience.
Why Bold BI Is the Right Fit for Online Food Ordering Analytics
-
Unified operational visibility: Track revenue, orders, delivery times, and customer satisfaction in a single dashboard.
-
Peak demand visibility: Identify high-demand periods clearly to support better operational decisions.
-
Smarter demand and capacity planning: Use forecasting to plan drivers, delivery capacity, and resources effectively.
-
Customer experience insights: Understand key factors that influence customer satisfaction.
-
Flexible deployment: Deployment in the cloud or self-hosted environments for food tech platforms.
Compare Options At a Glance
| Feature | Bold BI Online Food Ordering Dashboard | Food Delivery Reports | Spreadsheets |
| Revenue & expense tracking | Yes | Limited | Manual |
| Order channel analysis | Yes | Limited | Manual |
| Delivery time insights | Yes | Limited | Manual |
| Revenue forecasting | Yes | Limited | No |
| Customer satisfaction tracking | Yes | Limited | No |
Frequently Asked Questions
More Articles About Online Food Ordering Analysis
-
Boost Your Online Sales with E-Commerce Analytics
 Explains how analytics dashboards help online businesses track orders, revenue trends, customer behavior, and channel performance, insights that directly apply to food delivery and online ordering platforms.
-
Top 10 Finance Dashboards for Global Businesses
Showcases practical financial dashboards for tracking revenue, expenses, forecasts, and profitability, useful for food delivery teams managing margins and operational costs.


