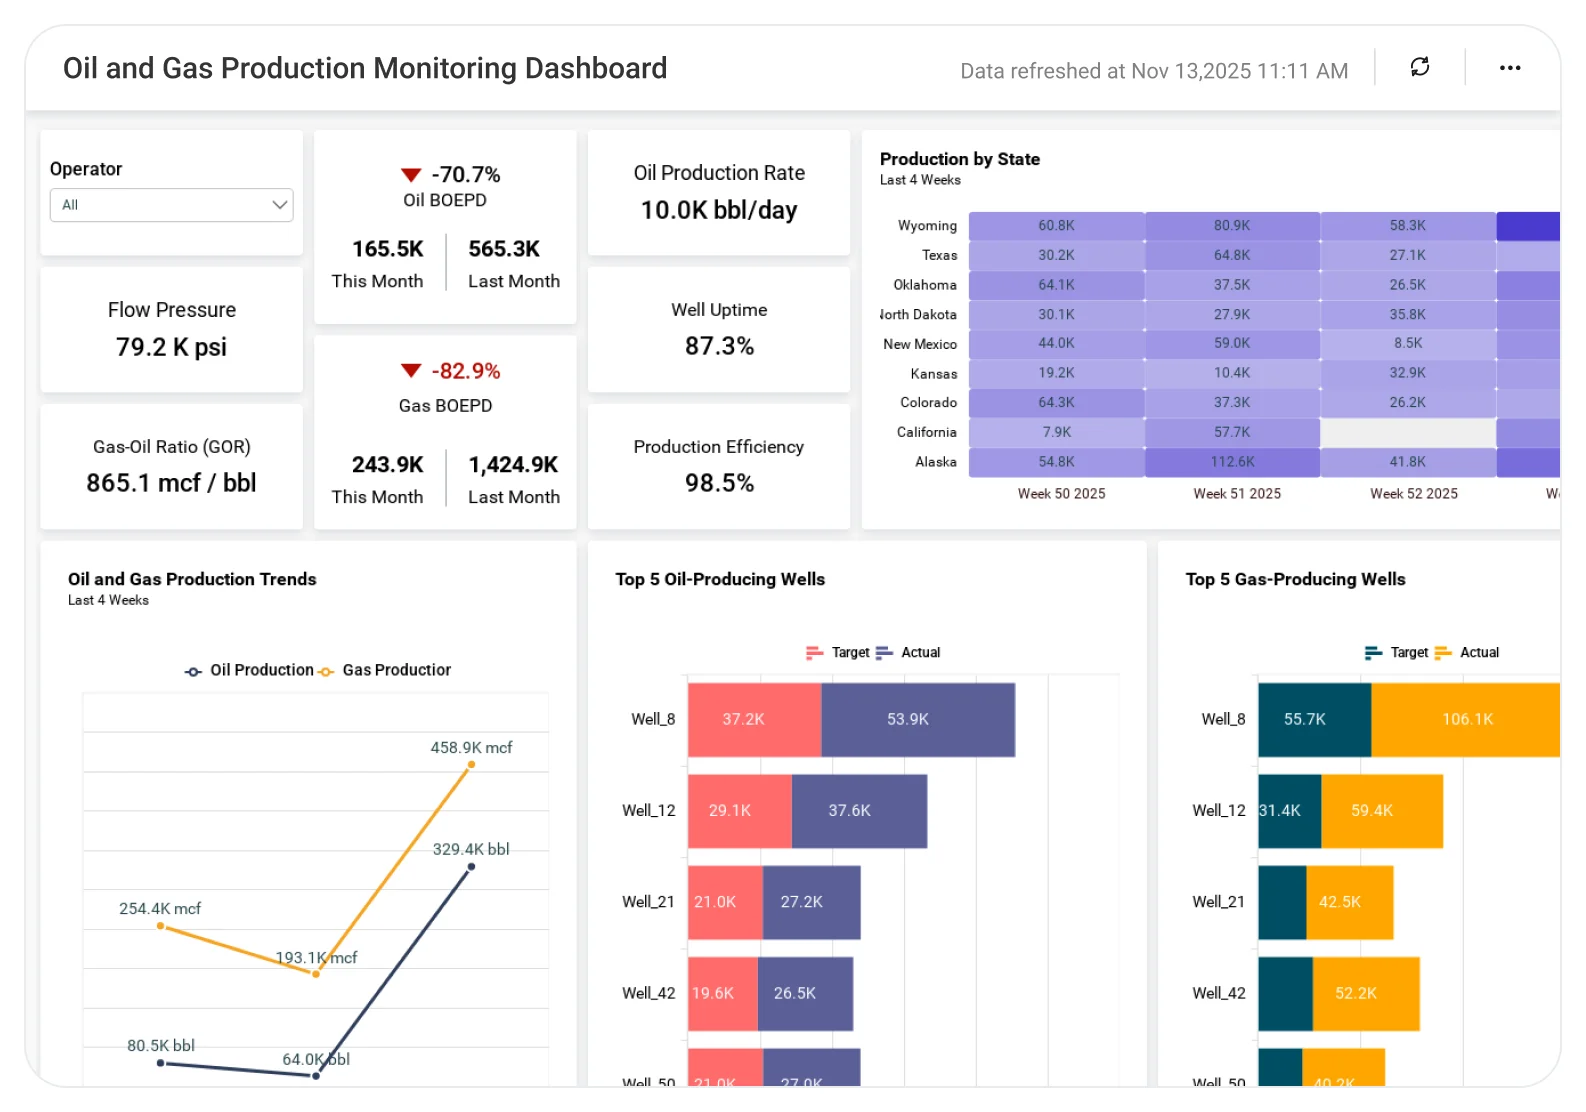
Oil and Gas Production Monitoring Dashboard
Understand oil and gas production performance to improve efficiency and reduce operational losses.
The Production Monitoring Dashboard helps teams analyze production volumes, downtime, and performance trends across assets, enabling better operational planning, reduced inefficiencies, and more reliable production outcomes.
TL;DR
-
Weekly BOEPD and week-over-week comparison.
-
Top-producing oil and gas wells.
-
State-wise production contribution.
-
Total production for the past month.
-
Operator-level production insights.
What Is an Oil and Gas Production Monitoring Dashboard?
An Oil and Gas Production Monitoring Dashboard is a visual analytics solution that helps energy companies track production output, compare performance across wells and regions, and analyze short-term and ongoing production trends.
In Bold BI, it becomes an interactive dashboard with KPIs, charts, maps, and filters, automatically updated from production data sources.
Why Oil and Gas Production Monitoring Dashboard Matters
Oil and gas operations rely on accurate, timely production data to make informed decisions.
Without a centralized dashboard:
-
Production changes are hard to spot early.
-
Top-performing wells are difficult to compare.
-
Regional output trends remain unclear.
Bold BI brings critical production KPIs into one dashboard, so leaders can monitor operations and identify trends with confidence.
What You’ll Track
-
Weekly BOEPD performance: Barrels of oil equivalent produced per day, with week-over-week comparison.
-
Top-producing wells: Oil and gas output from the highest-performing wells compared against targets.
-
State-level production: Total oil and gas production by state to identify high-performing regions.
-
Monthly production totals: Total production over the past month for operational review.
-
Recent production trends: Week-by-week production totals and state-wise breakdown for the last four weeks.
All dashboards are fully customizable, allowing you to add KPIs or metrics as needed.
How It Works
Why Bold BI Is the Right Fit for Oil & Gas Production Monitoring Analytics
-
Centralize production visibility: Combines BOEPD, well output, and regional production metrics in one view.
-
Support operational and trend analysis: Enables week-over-week and monthly performance tracking.
-
Executive-ready dashboards: Support both operational reviews and leadership decision-making.
-
Deploy flexibly: Supports cloud and self-hosted environments for energy operations.
-
Enable focused insights: Analyze production at the operator, well, and regional level.
Compare Options (at a glance)
| Feature | Bold BI Production Monitoring Dashboard | Operational Reports | Spreadsheets |
| BOEPD tracking & comparison | Yes | Limited | Manual |
| Top well performance insights | Yes | Limited | Manual |
| State-wise production analysis | Yes | Limited | Manual |
| Weekly & monthly trend tracking | Yes | Limited | Manual |
| Executive-ready dashboards | Yes | Limited | No |
Frequently Asked Questions
More Articles About Oil and Gas Production Monitoring Dashboard
-
Boost Oil and Gas Production Using Embedded Analytics
This blog shows how Bold BI® uses embedded analytics dashboards to monitor oil and gas production metrics and improve operational decision-making.
-
Manage the Oil and Gas Industry Effectively with Embedded BI
This blog explains how Bold BI® helps oil and gas companies create dashboards to monitor key operational and financial metrics such as production, revenue, and efficiency, enabling better performance tracking and decision-making.
-
Benefits of Embedded Analytics for the Oil and Gas Industry
This blog explains how embedded analytics with Bold BI® helps oil and gas companies gain real-time insights into production, equipment performance, and operational trends through dashboards, improving decision-making and efficiency.