
Law Firm Operations Dashboard
Track case workload, attorney utilization, and billing performance to strengthen law firm efficiency and profitability.
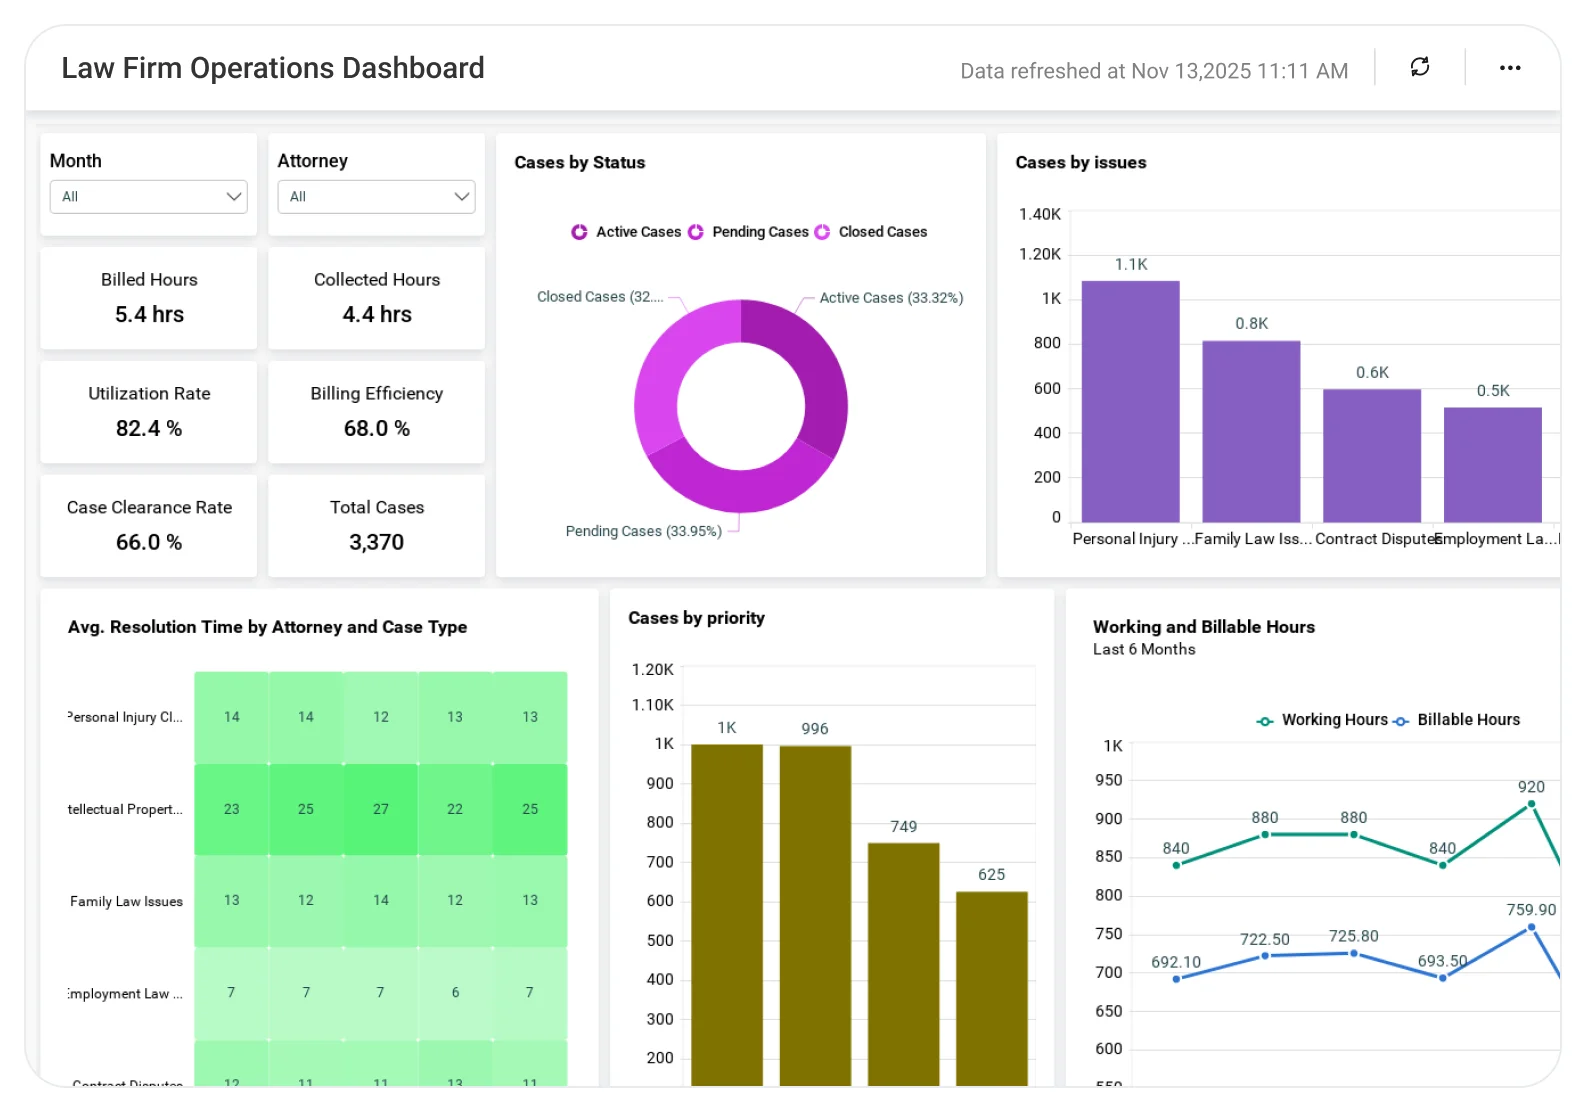
The Law Firm Operations Dashboard gives firm leaders and operations teams a centralized view of case workload, attorney utilization, billing performance, and overall productivity. This helps support better resource allocation and stronger financial control.
TL;DR
-
Track case workload and firm-wide performance trends to understand operational health.
-
Monitor attorney utilization and productivity to balance workloads and improve efficiency.
-
Analyze case volume and status by practice area or attorney to reduce backlogs and delays.
-
Review billing, revenue, and realization metrics to strengthen financial control and profitability.
-
Support smarter resource allocation and management decisions with data-driven legal operations insights.
What Is a Law Firm Operations Dashboard?
A Law Firm Operations Dashboard is an analytics solution that helps legal practices understand how effectively their people, cases, and finances are managed across the firm.
In Bold BI, this dashboard consolidates data from case management, time tracking, and billing systems to uncover inefficiencies, balance workloads, and support informed operational and strategic decisions.
Why Law Firm Operations Dashboard Matters
Law firms operate in a high-cost, time-sensitive environment where visibility into performance is critical.
When operational and financial data is spread across systems:
-
Attorney workloads become unbalanced.
-
Billable time leakage goes unnoticed.
-
Case backlogs impact client satisfaction.
-
Profitability is harder to measure accurately.
A centralized analytics dashboard enables law firms to move from reactive management to proactive, insight-driven operations.
What You’ll Track
Using Bold BI dashboards, you will track important KPIs such as:
-
Case workload distribution: Number of active, closed, and pending cases by practice area or attorney to manage capacity effectively.
-
Attorney utilization metrics: Billable vs. non-billable hours to assess productivity and optimize staffing.
-
Billing & revenue performance: Billed amounts, collected revenue, and realization rates to understand financial health.
-
Practice area performance: Comparison of workload and revenue contribution across legal practice areas.
All dashboards are fully customizable, allowing you to add KPIs or metrics as needed.
How It Works
-
Apply the Law Firm Operations Dashboard sample.
-
Combine case, time, and financial data in one unified view.
-
Analyze insights by attorney, practice area, client, or time period.
-
Share role-based dashboards with partners, operations teams, and leadership.
Why Bold BI Is the Right Fit for Law Firm Operations Analytics
-
Unified firm visibility: Bring case, time, and billing data into a single analytics dashboard.
-
Centralized operational analysis: Evaluate workload, productivity, and revenue together.
-
Comparative insights: Compare attorneys, teams, or practice areas to identify imbalances and opportunities.
-
Actionable drilldowns: Explore underutilization, billing gaps, or case delays in detail.
-
Enterprise-grade security & governance: Protect sensitive legal operations data using Row Level Security(RLS), Single Sign-On(SSO), Role-Based Access Control(RBAC), token authentication ,and audit logs.
-
Flexible deployment: Deploy securely in cloud or self-hosted environments to meet confidentiality and compliance requirements.
Compare Options (at a glance)
| Feature | Bold BI | Legal System Reports | Spreadsheets |
| Law firm operations analytics | Yes | Limited | Manual |
| Attorney utilization insights | Yes | Partial | Manual |
| Billing & revenue analysis | Yes | Limited | Manual |
| Practice-area comparison | Yes | Limited | Manual |
| Custom KPIs & drilldowns | Fully customizable | Fixed | Manual |


