
Coronavirus Disease (COVID-19) Analysis Dashboard
Analyze COVID-19 trends to support timely public health decisions and response planning.
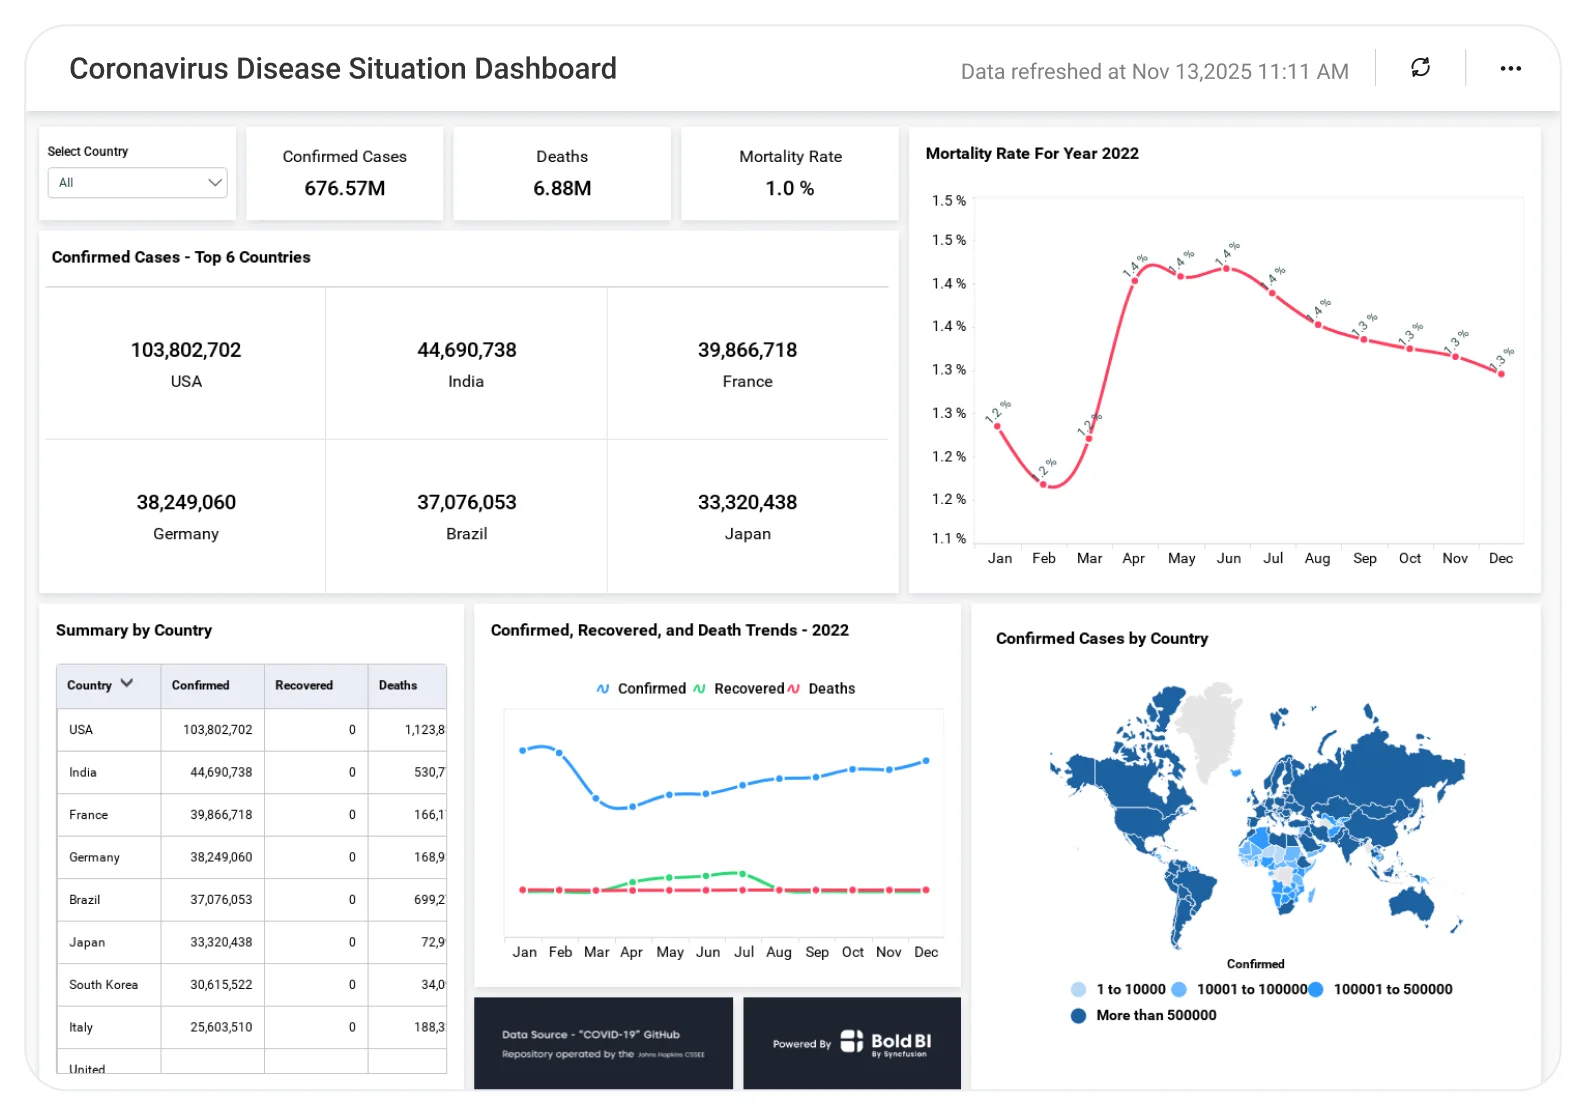
The Coronavirus Disease Analysis Dashboard helps healthcare authorities analyze case trends, recovery rates, and regional impact, enabling informed planning, effective resource allocation, and improved response strategies.
TL;DR
-
Total confirmed COVID-19 cases worldwide.
-
Total recovered cases.
-
Death counts and mortality rate.
-
Top affected countries by case count.
-
Recent global trends over the past 50 days.
What Is a COVID-19 Analysis Dashboard?
A COVID‑19 Analysis Dashboard is a visual analytics solution that helps users monitor the spread, recovery, and impact of COVID‑19 across regions and time periods.
In Bold BI, it becomes an interactive dashboard with KPIs, charts, maps, and filters that update automatically from global health data sources.
Why a COVID-19 Analysis Dashboard Matters
Public health decisions depend on timely, accurate COVID-19 data that is easy to analyze and compare.
Without a centralized dashboard:
-
Global trends are hard to compare.
-
Changes in infection or recovery rates are missed.
-
Country-level analysis requires multiple data sources.
Bold BI brings key COVID-19 metrics into one dashboard so users can understand the global situation and track how it evolves over time.
What You’ll Track
-
Global confirmed cases: Total number of reported COVID-19 cases worldwide.
-
Recovery trends: Number of patients who have recovered from COVID-19.
-
Mortality rate: Death counts and mortality percentage to assess severity.
-
Country-level impact: Case distribution by country, including the most affected regions.
-
Recent trend analysis: Changes in confirmed cases, recoveries, and deaths over the past 50 days.
All dashboards are fully customizable, allowing you to add KPIs or metrics as needed.
How It Works
-
Pick the Covid-19 analysis Dashboard sample.
-
Blend patient, staff, and financial data for a complete picture.
-
Sharing role-specific perspectives with the administrators, department heads, and directors.
-
Creating alerts for maximum capacity, readmission, or cost anomalies depending on the hospital's situation.
Why Bold BI Is the Right Fit for Covid-19 Analytics
-
Connect public health data easily: Integrates global COVID-19 datasets from trusted data sources.
-
Centralize outbreak monitoring: View cases, recoveries, deaths, and mortality metrics together—without switching between sources.
-
Support geographic analysis: Enables country-level comparisons to identify hotspots.
-
Deploy flexibly: Supports cloud and self-hosted deployment for healthcare organizations.
-
Enable trend tracking: Designed to monitor short-term trends and pattern changes.
Compare Options (at a glance)
| Feature | Bold BI COVID-19 Analysis Dashboard | Public Reports | Spreadsheets |
| Global case tracking | Yes | Limited | Manual |
| Country-level comparisons | Yes | Limited | Manual |
| Trend analysis over time | Yes | Limited | Manual |
| Interactive filtering | Yes | Limited | No |
| Dashboards designed for public health and leadership reporting | Yes | Limited | No |
Frequently Asked Questions
More Articles About COVID-19 & Public Health Analytics
-
Coronavirus (COVID-19) Outbreak Analysis
 Explains how interactive BI dashboards help track global COVID-19 cases, recoveries, deaths, and trends—enabling healthcare teams and public authorities to analyze outbreak patterns more effectively.


